
Executive Summary
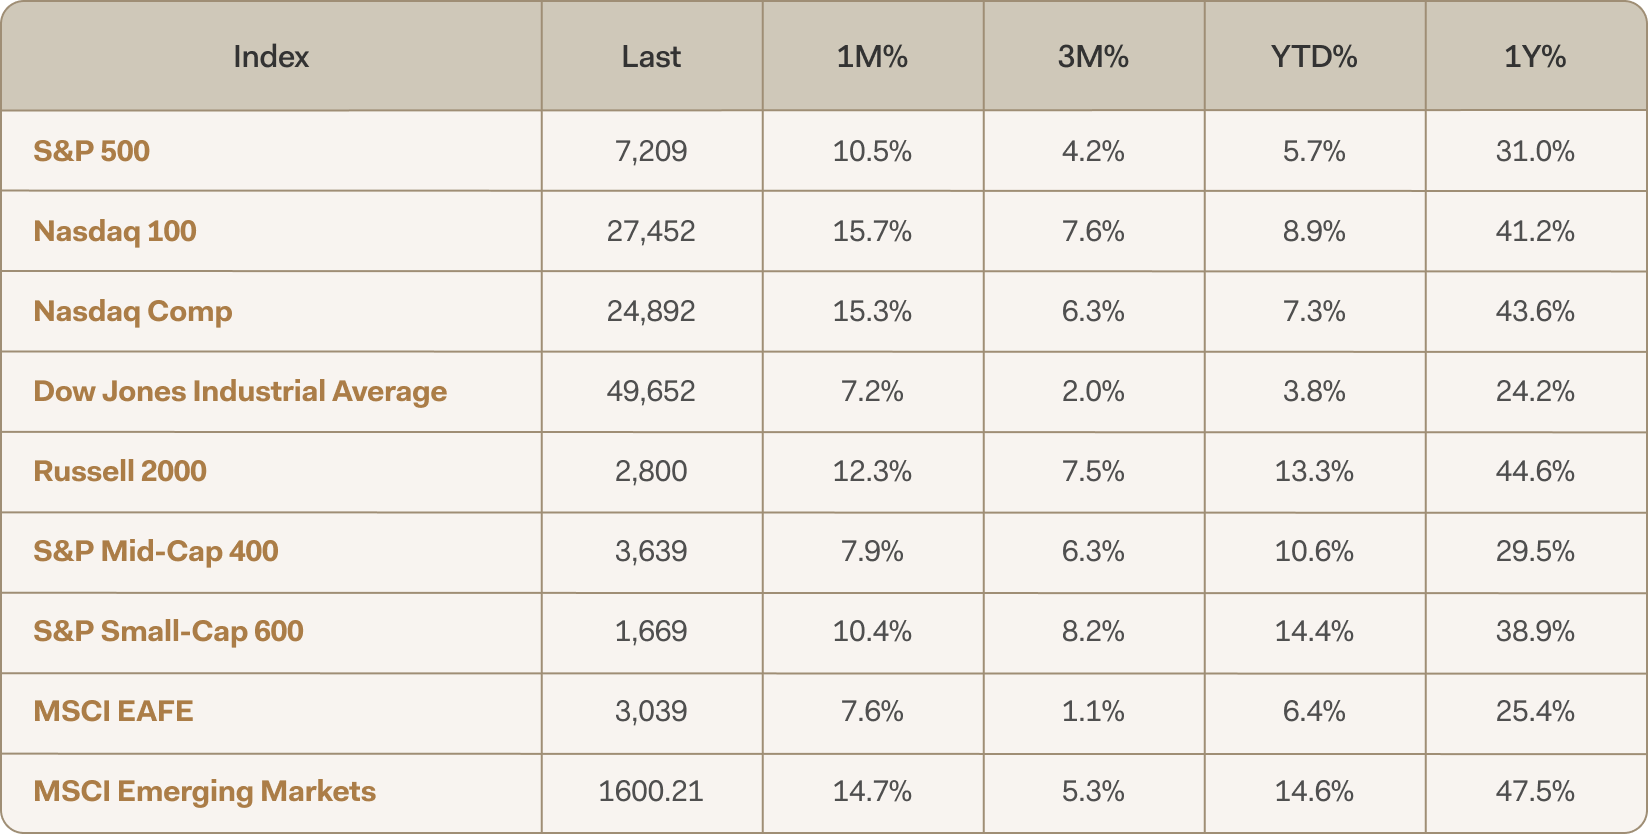
Equities ended April at fresh record highs. The S&P 500 closed April at 7,230, advancing approximately 10% on the month, 5.7% year to date, and 31% over the trailing 12 months. Beneath the surface, however, the U.S. economy continues to display the hallmarks of a late-cycle expansion. Growth is decelerating relative to earlier in the cycle, the labor market is softening, and inflation remains sufficiently sticky to keep monetary policy restrictive.Our reading of the cycle is clear. We are no longer in the high-conviction, risk-on regime that defined 2023 and 2024. The next 12 months are likely to reward breadth of diversification rather than concentration of conviction. Accordingly, the most important shift in our strategic orientation is not a tactical bet on any single asset, but a deliberate widening of the opportunity set across a broader range of return drivers.First-quarter 2026 corporate earnings grew approximately 27% year-over-year (y-o-y), the strongest pace since the fourth quarter of 2021, providing a meaningful cushion beneath equity prices1. At the same time, credit spreads sit near multi-decade lows, leaving little margin for adverse surprises. Our strategic asset allocation guidance reflects this asymmetry through overweights to real assets and gold, an overweight to short-duration bonds and cash, a meaningful tilt toward higher-yielding international fixed income, and broadened equity factor exposure favoring mid-capitalization, value, and international markets.
Economy: growth, but softening at the edges
The U.S. economy continues to grow, expanding at approximately 2.0% annualized in the most recent quarter. The pace of growth has nevertheless moderated. The labor market provides the clearest evidence of this deceleration, with the unemployment rate having risen to 4.3%, well above its prior cycle low. The Sahm rule, a recession indicator based on the pace of labor-market deterioration, currently sits 0.43 percentage points above its trailing 12-month low.2 This level is meaningfully closer to its 0.50 percentage points trigger threshold, although it has not yet been breached.Inflation forms the other half of the picture. Headline Consumer Price Index (CPI) inflation is running at 3.3% year-over-year and Personal Consumption Expenditures Price Index, Excluding Food and Energy (core PCE) inflation at 3.2%, both well above the Federal Reserve’s (Fed’s) 2% target.3
The Fed: fractured and in transition
April’s Fed meeting concluded with a decision to leave rates unchanged at 3.50% to 3.75% on April 29. However, the meeting was contentious. There were four dissenting votes, the highest number since 1992. Beth Hammack, Neel Kashkari, and Lorie Logan dissented against maintaining the easing bias in the statement, while Stephen Miran again dissented in favor of a 25 basis points (bps) rate cut.4 This marked the final meeting chaired by Jerome Powell, with Kevin Warsh set to lead the next meeting. Warsh inherits a visibly fractured Fed, as evidenced by the level of dissent. Given the division around the easing bias, further rate cuts appear unlikely in the near term, particularly as the Iran conflict persists.
Another atypical development is that Powell is expected to remain a Fed governor after his term as chair ends, a move last seen in 1948. His continued presence could present challenges as Warsh attempts to unify the committee, even if Powell maintains a low profile.
AI CapEx: the expansion’s unlikely anchor
Capital expenditures from Artificial Intelligence technology leaders, commonly referred to as hyperscaler CapEx, is a theme we have highlighted in prior letters that continues to provide a meaningful tailwind to the U.S. economy. First-quarter hyperscaler CapEx rose 70% y-o-y to $132 billion, with spending expected to accelerate further through the balance of the year. Current projections suggest 2026 hyperscaler CapEx could again grow approximately 70% y-o-y, reaching roughly $700 billion. The so-called “Mag 7” technology leaders accounted for approximately 35% of total S&P 500 CapEx in 2025, underscoring the concentration of investment driving this cycle.5 While the ultimate return on these AI investments remains uncertain, the scale and persistence of this spending make a near-term U.S. recession difficult to envision. The magnitude of hyperscaler CapEx alone is providing a meaningful uplift to GDP and supporting broader economic activity.
Equities: Q126 Earnings are doing the work
April produced a powerful equity rally, with the S&P 500 advancing nearly 10% on the month. Bank of America research noted that April’s performance ranked in the 98th percentile of monthly returns dating back to 1928. Notably, the rally was narrow. Mega-cap stocks were the primary drivers, as reflected in the divergence between the S&P 500 (+10% MTD) and the equal-weighted S&P 500 (RSP), which gained only 6% for the month.First quarter earnings have been solid, with a continued strong earnings forecast. Approximately 70% of S&P 500 companies have reported:
- Revenue surprise: +2.1% (vs. 1.3% historical average)
- EPS surprise: +21% (vs. 4.4% historical average)
- 2026 EPS growth: +21% consensus
- 2027 EPS growth: +14% consensus
- Realized trailing twelve months (TTM) EBIT margins: 18.8%
- Margins are anticipated to expand to 20% for 2026 and 21.3% for 20276
If this earnings momentum continues, elevated valuations may remain justified. Earnings ultimately drive markets, and profit growth continues to provide a supportive foundation, particularly with the continued anticipated margin expansion for the S&P 500.


International developed markets and emerging markets have likewise participated in the global advance. Volatility has retreated meaningfully, with the VIX closing April at 17.0, well below its long-run average. Historically, regimes characterized by low realized and implied volatility have rewarded patient, broadly diversified investors, and we expect that pattern to continue.

Strategic asset allocation guidance: We recommend that clients remain invested in equities at strategic weight in aggregate, while tilting away from concentration in mega-capitalization leadership. Within equities, we favor an overweight to mid-capitalization and value relative to strategic targets, a market weight to international developed and emerging markets, a modest overweight to growth and quality, and a neutral stance on large-capitalization blend and small-capitalization. Diversification is not without cost, but it is currently inexpensive relative to its long-run value.
Fixed income: Yield without heroics
The 10-year U.S. Treasury yield closed April at 4.37%, 7 bps higher on the week and 5 bps higher on the month. The 2-to-10-year Treasury yield curve has steepened modestly to a positive slope of 50 bps, a healthier configuration than the inversion that prevailed in 2022 and 2023.7

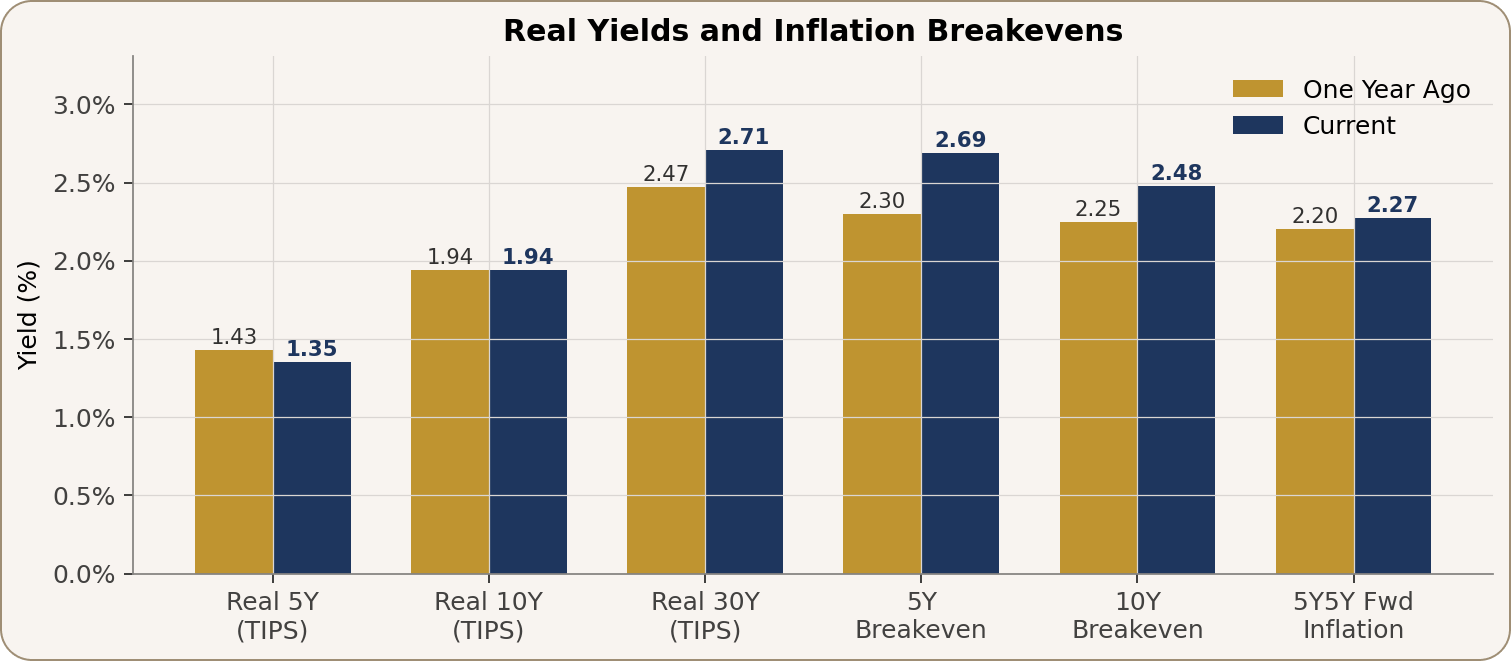
The opportunity in bonds today resides in the starting yield itself. With the front end of the curve near 3.7% and intermediate maturities pricing only modest further easing, owning high-quality, liquid fixed income earns a real return without requiring substantial duration risk. Within credit, however, we remain disciplined. Investment-grade corporate spreads of 81 bps sit near their tightest levels in three decades, while high-yield spreads of 283 bps are at levels not seen since 2007. The market is offering little incremental compensation for incremental credit risk, and we decline to reach for yield at these levels.8

Strategic asset allocation guidance: Within fixed income, we recommend an overweight to short-duration Treasuries and high-quality short-maturity bonds, a neutral position on intermediate Treasuries, and an underweight to long-duration government bonds. We are underweight investment-grade corporate credit given historically tight spreads, neutral on high yield (held for income rather than spread compression), and overweight US-dollar-denominated emerging-market debt, where the yield premium is most attractive on a risk-adjusted basis.
Alternatives: Real assets and real diversification
A late-cycle environment characterized by sticky inflation and compressed credit cushions is precisely the regime in which alternatives earn their keep. Strategic allocations should incorporate a meaningful sleeve across real assets, real estate, and commodity-linked exposures. The composition of this sleeve matters as much as its size. Gold serves as a monetary and tail hedge. Real estate provides income and inflation linkage. Infrastructure contributes regulated, contracted cash flows that have historically dampened drawdowns. Broad commodities and natural-resources equities participate when supply-driven inflation persists.We recommend an above-strategic weight to gold because the conditions that historically support the asset are all present today. These conditions include restrictive real rates that are nevertheless declining at the margin, central-bank reserve diversification away from the dollar, and elevated geopolitical risk. Gold has a low long-run correlation with equities and bonds, and that correlation has tended to fall further during regimes of policy uncertainty. Real estate and infrastructure diversify equity beta into income streams whose drivers are different from corporate earnings, including leases, regulated returns, and demographic demand. They also offer a degree of inflation pass-through that pure financial assets do not.Strategic asset allocation guidance: Within alternatives, we recommend an overweight to gold above its long-run strategic weight, an overweight to real estate and infrastructure, and a modest overweight to broad commodities and natural-resources equities. Alternatives should not be regarded as a speculative satellite. They are part of the structural core of a thoughtful 2026 allocation.
Strategic asset allocation recommendations
Rather than prescribing specific portfolio weights, our positioning is best expressed as a series of tilts relative to each investor’s strategic asset allocation. Our recommended asset allocation tilts are influenced by Farther’s internal capital market assumptions, shown in the table below, and the risk-reward spectrum relative to underlying asset class volatility.

The table below summarizes our current overweight, neutral, and underweight stances by asset class, together with the underlying rationale. These tilts are intended to be applied to a client’s individualized strategic asset allocation and risk profile, and should not be interpreted as a one-size-fits-all model.

What we are watching
These four developments could materially alter our view over the coming months:
- Labor market: Should the three-month moving average of the unemployment rate rise more than 0.50 percentage points above its prior 12-month low (it currently sits at 0.43 percentage points), the Sahm rule would trigger, therefore indicating an increased probability of a recession. In that event, we would expect to extend recommended duration and reduce credit risk.
- Oil: Commodity markets have remained relatively subdued despite the closure of the Strait of Hormuz. ExxonMobil noted on its recent earnings call that the full impact of supply disruptions has yet to materialize, as inventories and Strategic Petroleum Reserve releases are currently acting as a buffer. However, as we enter the peak summer demand season for transportation fuels and these buffers begin to decline, ongoing disruptions in the Strait of Hormuz are increasingly likely to push oil prices higher and raise the probability of a global recession.
- Inflation: A re-acceleration of core PCE above 3.5% would compel the Fed to pause or reverse its easing cycle. Such an outcome would weigh on both equities and bonds and would prompt a more defensive posture across the strategic allocation.
- Credit: A meaningful widening from today’s compressed spreads would represent the most reliable early-warning indicator of a deteriorating cycle. Such a development would prompt us to harvest gains from risk assets and shift recommended exposure toward higher-quality holdings.
We will continue to publish this commentary monthly and will update our strategic allocation guidance as the data evolves. Clients are encouraged to contact their Farther advisor with questions about how this view applies to their specific financial plan.
Where major markets stand
Sources
1 Source: FactSet. S&P 500 Earnings Season Update, May 1, 2026
2 Source: Federal Reserve Bank of St. Louis (FRED). Real-Time Sahm Rule Recession Indicator. The Sahm Rule is a real-time economic indicator, developed by economist Claudia Sahm in 2019, that signals the start of a recession when the three-month moving average of the national unemployment rate (U3) rises by 0.50 percentage points or more relative to its 12-month low. It is designed to trigger timely fiscal policy responses.
3 Source: Bureau of Economic Analysis, April 30, 2026.
4 Source: Federal Reserve. FOMC Statement, April 29, 2026 (federalreserve.gov).
5 Source: JP Morgan Equity Research April 29, 2026.
6 Source: Morgan Stanley Equity Research, May 4, 2026.
7 Source: Federal Reserve Bank of St. Louis (FRED). ICE BofA US High Yield Index Option-Adjusted Spread.
8 Source: InvestmentGrade.com. Credit Spreads Q1 2026: Investment-Grade OAS at Three-Decade Lows.
Disclosures
Farther Finance Advisors, LLC (“Farther”) is an SEC-registered investment adviser; however, such registration does not imply a certain level of skill or training, and no inference to the contrary should be made. The information contained herein is for discussion purposes only and no representations or warranties are given or implied. This material represents an assessment of the market environment and general investment strategies at a specific point in time and is not intended to be a forecast of future events or a guarantee of future results. It is intended for educational purposes only and is not intended as individual investment advice.
The views, opinions, and analyses expressed in this presentation are those of Alex S. Paul, CFA®, Director, Advisor Investment Strategy, and Vinit Madan, CMT, Advisor Investment Strategy Specialist, as of the date of this presentation. They represent the personal views of the individual authors and do not constitute a recommendation, solicitation, or offer to buy or sell any security or investment product by Farther Finance Advisors, LLC or any of its affiliates. These views are subject to change at any time without notice based on market and other conditions, and no obligation is undertaken to update them. While we believe this information is derived from sources we deem reliable, we do not represent that it is accurate and complete, and it should not be relied upon as such. Investing in securities involves risks, including the potential loss of principal, and there is always the potential of losing money when investing. Past performance does not guarantee future results, which may vary. Different types of investments involve varying degrees of risk, and it should not be assumed that future performance of any specific investment or strategy will be profitable, equal any historical performance level(s), be suitable for your portfolio or individual situation, or prove successful. Diversification does not protect against loss in declining markets.
This presentation does not take into account the specific objectives, financial situation, or particular needs of any specific person and therefore should not be relied upon as investment, legal, or tax advice. Farther does not provide tax or legal services. The economic and market forecasts presented herein reflect the authors’ assessments as of the date of this presentation; there can be no assurance that such forecasts will be achieved. Neither the individual presenters nor Farther Finance Advisors, LLC shall be liable for any direct, indirect, incidental, special, exemplary, or consequential damages arising from the use of or reliance upon the information presented herein.
Before investing, please consider your investment objectives and consult with your Farther financial advisor regarding your individual circumstances, including Farther Finance Advisors, LLC’s fees and expenses. It remains your responsibility to advise Farther Finance Advisors, LLC in writing of any changes in your personal or financial situation or investment objectives. For additional information, please refer to our Form ADV Brochure, Privacy Policy, and Terms of Service available at farther.com.
© 2026 Farther Finance Advisors, LLC. All rights reserved. For informational purposes only. Not for further distribution without prior written consent.