Executive Summary
Risk assets closed May at record highs on exceptionally narrow leadership driven by the growth of artificial intelligence (AI), while the underlying economy remained in a late-cycle expansion — i.e. the mature phase, when economic growth is still positive, but the conditions that sustain it are increasingly strained.
The S&P 500 finished May with its ninth consecutive positive week and recorded 11 new highs during the month. Markets continued to “climb a wall of worry” including concerns surrounding geopolitics and the impact of higher oil prices, rising interest rates, potential changes in Federal Reserve leadership, fears of a private credit downturn, and recurring predictions regarding the demise of the software industry.
The investment implications remain consistent with our views last month: we want to own durable carry (from investments that offer a yield or income advantage that is expected to persist over time), maintain real diversification, and will decline to pay a premium for risk that is not compensated.
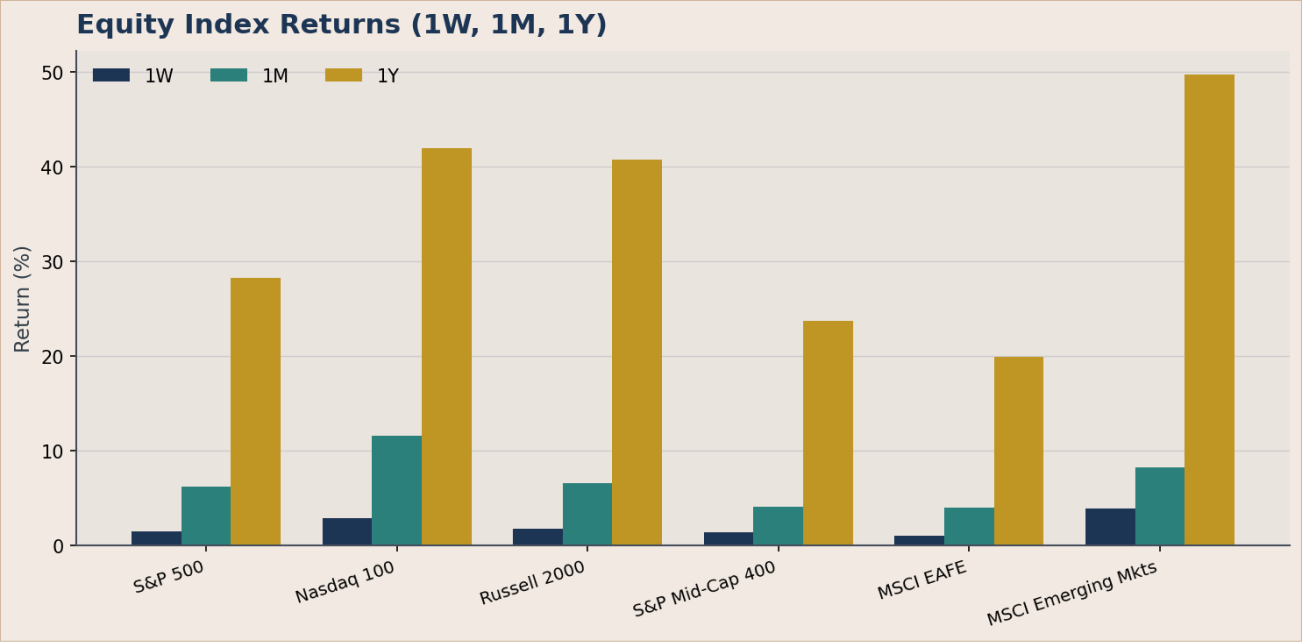
- Markets: The S&P 500 rose 6.2% to a record 7,580, the Nasdaq 100 rose 11.6% to 30,333 , and emerging-market equities rose 8.3% . Leadership was narrow and concentrated in the momentum factor: the S&P 500 High Beta index advanced 13.9% while the S&P 500 Low Volatility index fell 2.2%.
- Rates: The 10-year Treasury yield stands at 4.45% and the 2s10s curve is positively sloped at 47 basis points. With the front end near 3.7%, high-quality fixed income earns a real return without material duration risk.
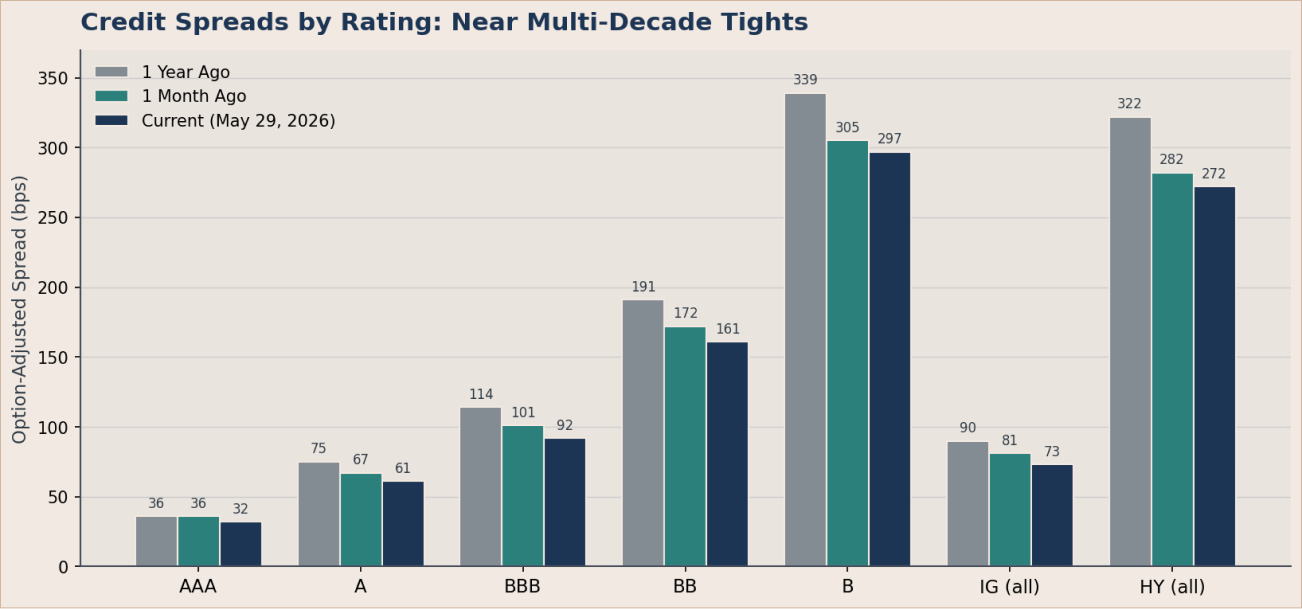
- Credit: Investment-grade spreads of 73 basis points and BB high-yield spreads of 161 basis points sit near multi-decade tights. The incremental compensation for incremental credit risk is inadequate.
- Strategic positioning: We are overweight U.S. growth and quality, emerging-market equity (Asian tech supply chain), short-duration Treasuries, USD-denominated emerging market debt, real estate, cash, and gold. We are underweight lower-quality credit, long-duration Treasuries, and illiquid private markets.
Strategic asset allocation: Positioning summary
The table below summarizes the Farther Investment Strategy Team’s active stance by asset class relative to a strategic-neutral policy allocation, with a conviction rating and the principal rationale. The narrative that follows develops the reasoning behind each major overweight and underweight.
The big picture
May was, on the surface, an extraordinary month for risk assets. Twelve-month total returns now stand at 28.2% for the S&P 500, 42.0% for the Nasdaq 100, and 49.7% for the MSCI Emerging Markets index. International developed markets, represented by the MSCI EAFE index, added 4.0% on the month and 19.9% over the trailing year.
Beneath that rally, the tape narrowed sharply. Russell 1000 Growth gained 7.6% against 4.7% for Russell 1000 Value. Communication Services and Information Technology dominated, while defensives such as Real Estate and Consumer Staples declined or barely participated. This is the signature of a leadership regime concentrated in a small number of mega-capitalization names rather than a broad cyclical expansion.
Our read of the underlying economy is unchanged from the prior month. We remain in a late-cycle economic expansion: growth has decelerated, the labor market has loosened, and inflation re-accelerated in the most recent data. The Federal Open Market Committee held the policy rate at 3.50% to 3.75% in late April in an eight-to-four decision, with one dissent favoring a cut and three preferring to drop the easing bias entirely. Futures markets began the month pricing some probability of a rate increase by year-end.
“It’s a tech world after all”
The momentum behind AI continues to accelerate, as evidenced by the outperformance of the NASDAQ (QQQ gained 32%) and the Technology Select Sector SPDR (XLK up 50%) relative to the S&P 500 (up 20%) from the March 30 low through May 29. AI enthusiasm has lifted many legacy technology companies that were previously viewed as industry dinosaurs. Intel (210% YTD), Dell (237% YTD), Cisco (58% YTD), Nokia (132% YTD), and Micron (240% YTD) have all surged into significantly overbought territory, with several exceeding their prior peaks from the 1999 technology bubble.
AI’s influence on market performance has become increasingly dominant. J.P. Morgan Asset Management estimates that AI-related industries now represent nearly 60% of the S&P 500. Goldman Sachs recently noted that technology accounted for approximately 85% of the S&P 500’s YTD return through mid-May, when the index was up roughly 8%, while the index excluding technology generated only a modest gain. (As of May 29, the S&P 500 was +10.7% YTD on a price basis, +11.3% total return.) AI enthusiasm continues to be the primary driver of both momentum and growth factors across the market.
Bullish investors argue that this performance is justified. Technology sector earnings are forecast to grow 45% in 2026 and 31% in 2027. Based on these projections, the sector’s forward P/E multiple would decline to approximately 24x, representing a meaningful discount to its projected three-year earnings growth rate of 34%. The strength of the technology sector has also lifted broader market expectations, with S&P 500 earnings growth projected at 22% in 2026 and 15% in 2027.
Year-to-date, the S&P 500 has returned approximately 10%, while earnings estimates have increased by roughly 15%. As a result, the market’s valuation multiple has contracted by approximately 5%.
The state of the economy
Real GDP grew at roughly a 1.6% annualized rate in the most recent quarter; positive but materially slower than the 2024 average. The labor market continues to soften, as the three-month average of nonfarm payroll gains has averaged under 100,000 per month on a first-print basis over February-April (skewed by a February print of -156,000), down from cycle peaks above 200,000, and the unemployment rate has stalled at 4.3% — modestly above 2024 lows but unchanged for four consecutive months . The most recent employment report added 115,000 jobs, concentrated in health care, transportation and warehousing, and retail trade. Job openings (JOLTS) printed 6.87 million in March, broadly steady around the 6.9 million range since early winter after a 7.24 million January spike , and the University of Michigan consumer sentiment index fell to 49.8 from 53.3, a notable deterioration that bears watching.
Inflation surprised to the upside. Headline CPI rose 0.6% on the month, lifting the year-over-year rate to 3.8%, its highest reading since the summer of 2023, and core PCE rose to 3.3% year-over-year. A portion of the acceleration reflected energy: oil traded in the $100-110 range through much of April and the first half of May, with Brent peaking near $115 on May 4 as a disruption at the Strait of Hormuz removed a substantial share of seaborne supply, before reversing sharply on news of ceasefire negotiations. The thirty-year primary mortgage rate edged up to 6.53%, a reminder that the policy-sensitive parts of the real economy remain restrained.
Equities: Records on narrow leadership
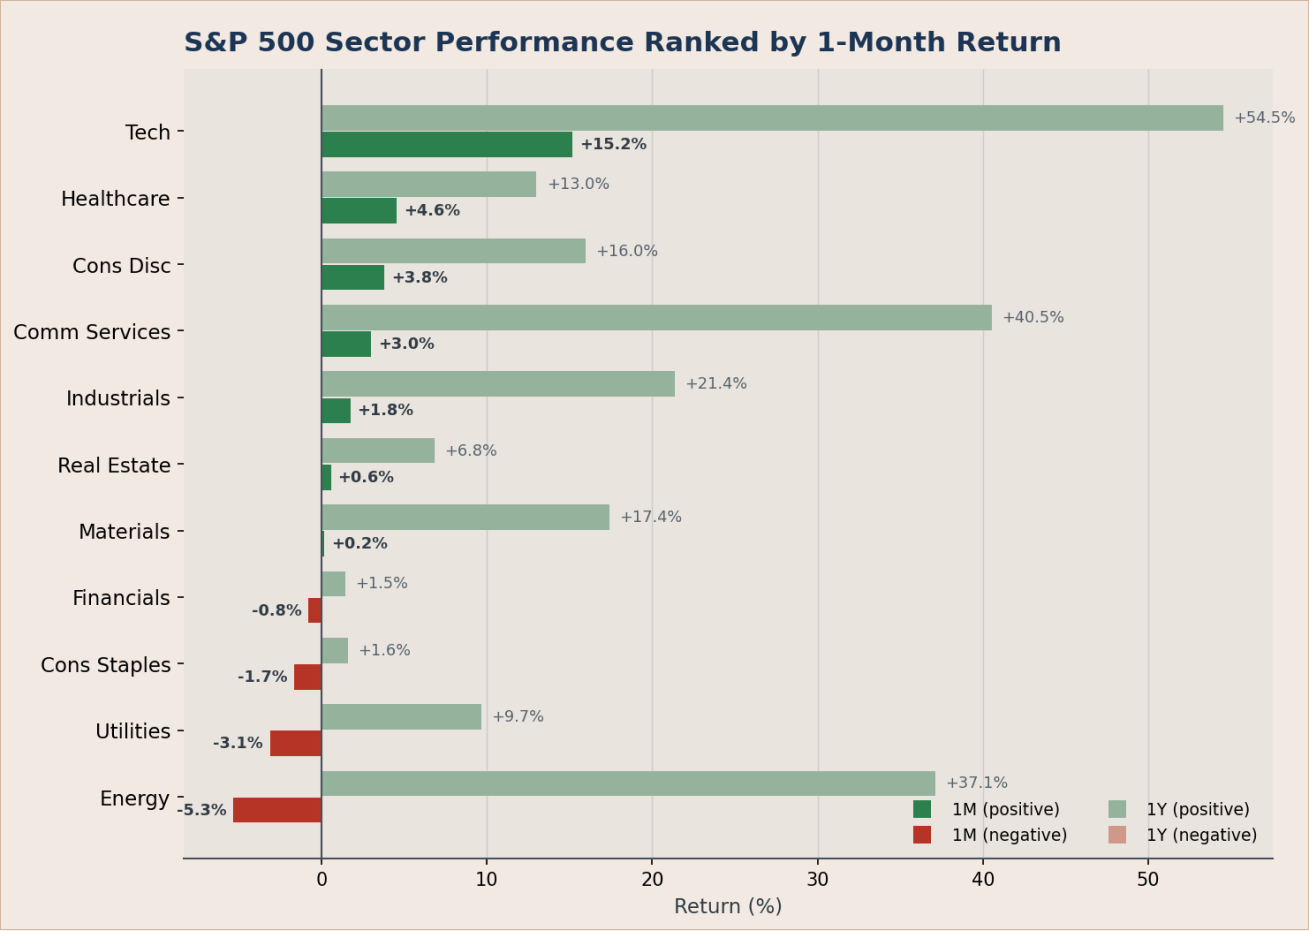
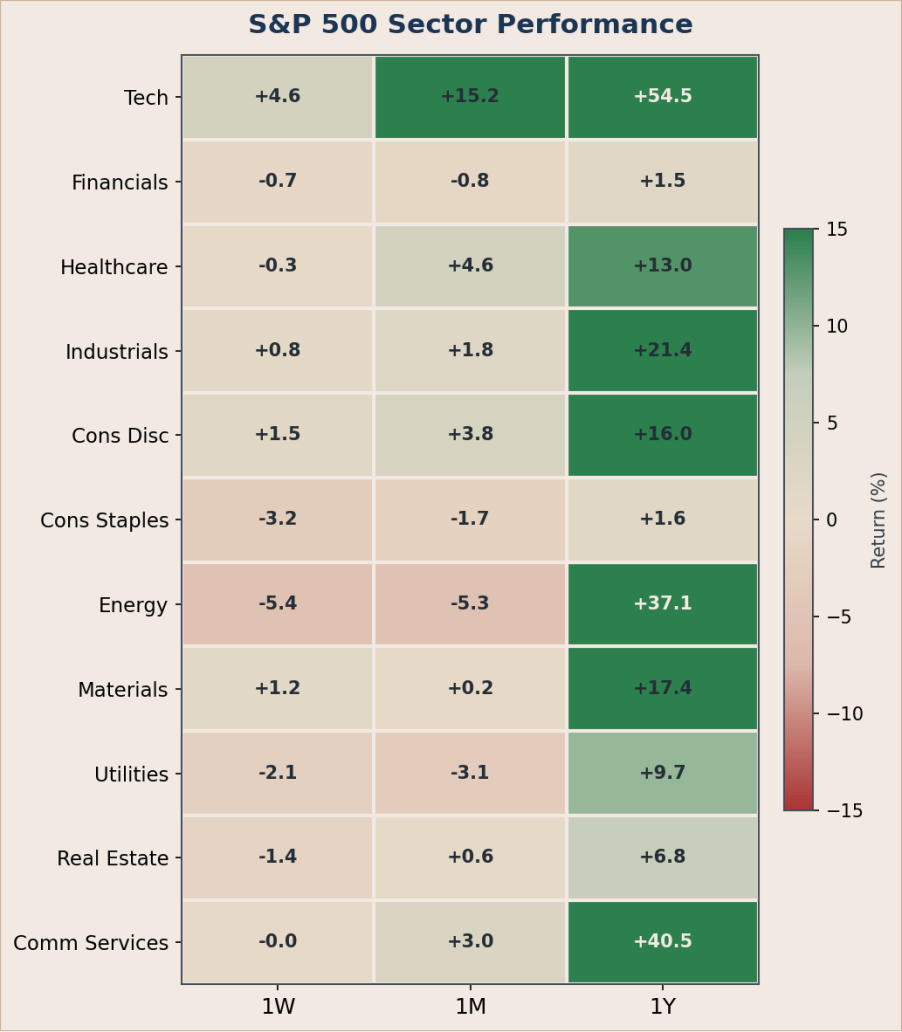
Technology and semiconductor names did the heavy lifting. The Information Technology sector rose 15.2% on the month and led the S&P 500, with Communication Services close behind. By contrast, Utilities fell 3.1%, Consumer Staples fell 1.7%, and Energy fell 5.3%. A concentrated index, like the current S&P’s composition, can print a record while several sectors decline, and that is precisely what occurred.
Mid-cap equities returned a more modest 4.1% in May and small caps gained 6.6%, while value and dividend factors lagged growth by several percentage points. Periods of narrow leadership have historically been followed by broadening, and we want the portfolio positioned for that rotation when it arrives.
International developed equities rose 4.0% in May, led by Japan, where the TOPIX gained 4.9% and the Nikkei 225 surged 10.7%. Emerging markets did even better at 8.3%, driven by Taiwanese semiconductors and a renewed China rotation. Taiwan now represents roughly 25% of the MSCI Emerging Markets index, with China close behind and India near 12%. The diversification benefit of holding international and emerging-market equities was evident, but the underlying concentration of those indices in AI-related semiconductor names is something we monitor closely.
Fixed income: A healthier yield curve
The ten-year Treasury yield stands at 4.45%, up 3 basis points on the month, and the thirty-year yield at 4.99%, up 1 basis point. The two-year yield rose 6 basis points to 3.98%, leaving the two-to-ten-year curve positively sloped at 47 basis points, a healthier configuration than the inversion that prevailed in 2022 and 2023. The intra-month range was wider than the month-end change suggests: the ten-year traded as high as 4.57% before rallying 11 basis points over the past week as oil reversed and ceasefire optimism spread.
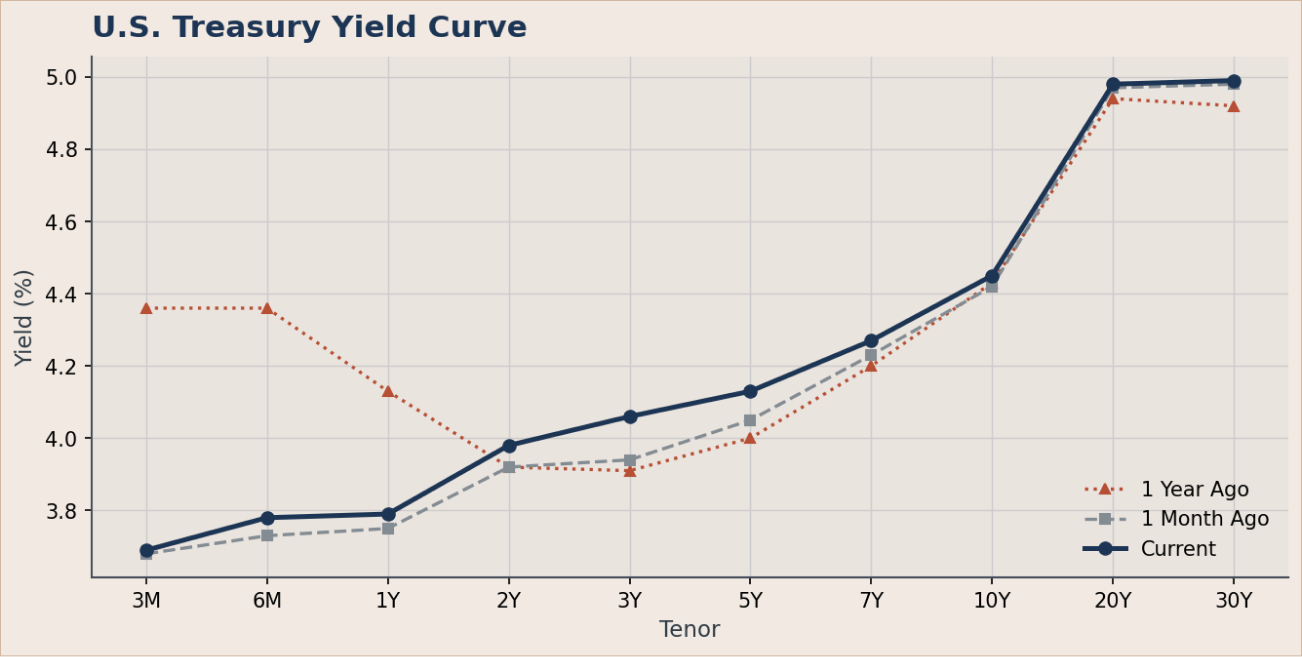
The opportunity in bonds today resides in the starting yield itself. With the front end of the curve near 3.7% and the intermediate “belly” near 4.1%, owning high-quality, liquid fixed income earns a real return without requiring substantial duration risk.
Within credit, however, the picture remains unforgiving: investment-grade spreads of 73 basis points and BB-rated high-yield spreads of 161 basis points sit near multi-decade tights. The market offers little incremental compensation for incremental credit risk, and we decline to reach for it.
The interest rate backdrop
Markets continue to advance despite the steady rise in long-term interest rates. During May, the yield on the U.S. 30-year Treasury bond climbed above 5%, the highest sustained levels since brief breaches in mid-2025. Higher energy prices have contributed to stronger inflation data and rising inflation expectations.
The debate now centers on what happens if an Iran peace agreement is ultimately achieved. While lower oil prices and softer inflation data could temporarily relieve pressure on bond yields, structural challenges remain. Rising government debt, persistent fiscal deficits, increased Treasury issuance, and substantial investment-grade corporate issuance to fund AI-related capital spending may keep long-term yields elevated.
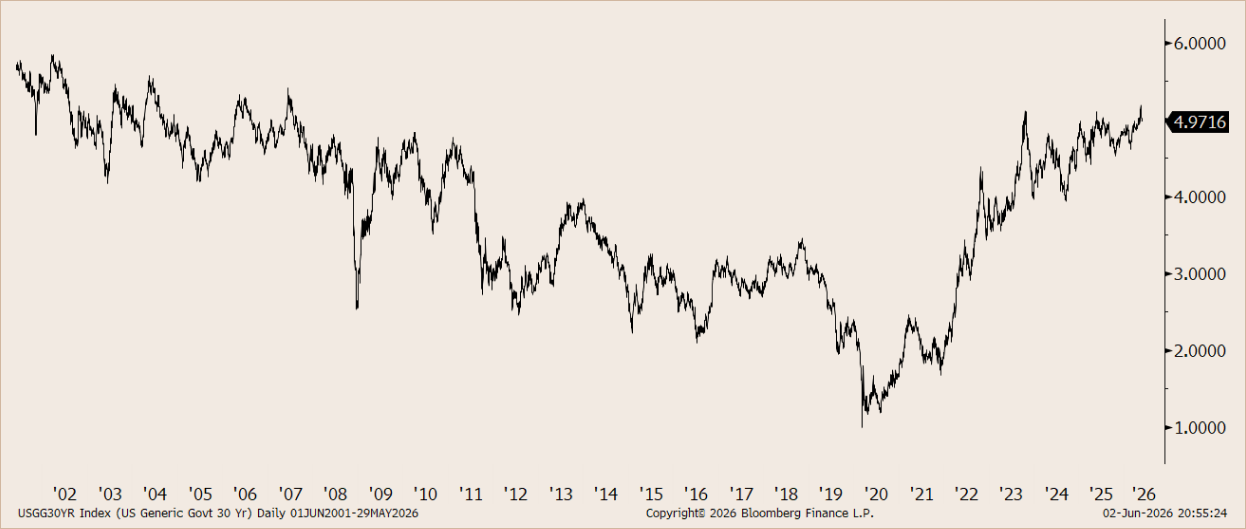
Notably, long-term rates have continued to rise despite the Treasury Department’s efforts to concentrate issuance at the short end of the curve in order to reduce upward pressure on longer maturities.
The bond market must also navigate the possibility of changes in Federal Reserve leadership and an increasingly likely shift away from the Fed’s easing bias. Federal Reserve meeting minutes acknowledged that the next policy move could potentially be a rate increase if inflation remains persistently above the 2% target. Further complicating the outlook is the current disconnect between the Fed Funds rate of 3.50% to 3.75% and the 2-year Treasury yield of approximately 3.98%. At a minimum, we believe investors should remain attentive to the possibility of a policy shift during the upcoming June meeting.
Alternatives and real assets
Gold consolidated in May. After advancing more than 37% over the trailing twelve months, the metal traded flat for the month at $4,560 per ounce as the dollar firmed modestly and oil reversed on the ceasefire bid. We continue to hold gold as a core position. The conditions that historically support it remain present: restrictive real rates that are nevertheless declining at the margin, central-bank reserve diversification away from the dollar, and elevated geopolitical risk. Over the trailing year, gold has delivered both meaningful return and meaningful diversification, exhibiting low correlation with equities and credit during periods of stress.
Broad commodities retraced 3.6% in May after a powerful start to 2026, yet the BCOM index remains up 34.0% over the trailing twelve months, driven by oil and industrial metals. Copper rose 8.7% on the month to a multi-year high, reflecting structural demand from electrification, grid build-outs, and data-center construction. Real estate and infrastructure exposures provide income streams driven by leases, regulated returns, and demographic demand, economic drivers distinct from corporate earnings, and they offer a degree of inflation pass-through that pure financial assets do not.
How the portfolio is positioned, and why
Our portfolio spans a broad set of asset classes and is built around a few deliberate convictions rather than a long list of small bets. U.S. equities represent the largest block, led by high-quality large-cap, with complementary positions across growth, value, mid-cap, and small-cap. International exposure is meaningful and spans developed markets, developed small-cap, and emerging markets. Fixed income is a substantial allocation weighted toward the front end and belly of the Treasury curve, complemented by investment-grade corporates and smaller, diversifying sleeves in municipals, TIPS, agency mortgage-backed securities (MBS), U.S.-dollar emerging-market debt, and select credit. Long-duration Treasuries are held only sparingly. Cash is held as a deliberate optionality sleeve, and a core position in physical gold anchors a modest real-assets allocation.
The shape of the portfolio has changed meaningfully from a quarter ago. We reduced U.S. mid-cap and long-duration Treasuries materially, redeploying that capital into U.S. large-cap, the front of the Treasury curve, emerging markets, and the cash sleeve. We hold U.S. large-cap as the largest single position because, despite elevated multiples, the index continues to deliver double-digit earnings growth led by the artificial-intelligence-related mega-caps, and the breadth tilt that mid-cap historically provided no longer carries the same valuation discount it did a year ago.
Within fixed income, the duration profile is concentrated in the front end and belly of the Treasury curve, where carry is most attractive and convexity is least asymmetric. Short and intermediate Treasuries together with cash provide substantial dry-powder, yield-bearing capacity. We hold investment-grade corporates for incremental carry over Treasuries, and we remain deliberately light on lower-quality credit because option-adjusted spreads do not compensate for the risk at current levels.
Within alternatives, the gold position has been trimmed modestly as the metal consolidated following a powerful trailing-year run. We continue to hold gold for its low correlation with equities and bonds and its role as a tail-risk hedge in policy-uncertainty regimes; the smaller sizing reflects reduced inflation-acceleration risk in our framework relative to a quarter ago. At the total-portfolio level, the book remains broadly diversified across a meaningful number of independent return drivers, with a moderate expected volatility, consistent with a posture built to compound through a wide range of outcomes.
What we are watching
Three key developments would materially alter our view over the coming months:
- Labor market: Should the unemployment rate rise such that the three-month moving average crosses 0.50 percentage points above its prior twelve-month low, the Sahm rule would trigger. We would expect to extend portfolio duration meaningfully, reduce credit risk, and re-evaluate equity beta.
- Inflation: A re-acceleration of inflation (core PCE) above 3.5% year-over-year would compel the Federal Reserve to pause or reverse its modest easing, an outcome that would weigh on both equities and bonds and would likely benefit gold and broad commodities.
- Credit: A meaningful widening from today's compressed spreads, specifically high-yield BB above 250 basis points or investment-grade above 110 basis points, would represent the most reliable early-warning indicator. It would prompt us to harvest gains from risk assets and reallocate toward higher-quality holdings.
The path forward
Market momentum appears likely to remain intact in the near term. The current eight-week advance of approximately 19.5% ranks as the ninth largest rally of its kind in market history. In each of the previous eight occurrences, stocks were higher both three and six months later, with an average six-month gain of approximately 11%.
What could derail the rally? Two additional risks remain at the top of our watch list, complementing the labor market, inflation, and credit signals described above.
- Oil inventories: Continued disruption in the Strait of Hormuz could eventually lead to a meaningful depletion of global oil inventories. To date, interruptions in shipping activity have been offset by existing inventories and releases from strategic petroleum reserves. However, as these supports diminish and seasonal demand rises during the summer months, tighter supply conditions could push oil prices toward levels that begin to destroy demand. We estimate that threshold to be approximately $150 per barrel or higher.
- A wave of new equity supply: SpaceX is widely expected to lead a new generation of mega-cap technology IPOs, potentially followed by Anthropic and OpenAI. SpaceX alone is estimated to carry a valuation approaching $1.75 trillion. While the initial public float is expected to represent only about 4.3% of outstanding shares, future lockup expirations and secondary share sales could introduce a significant amount of additional equity supply into public markets. Collectively, SpaceX, OpenAI, and Anthropic could eventually add $4 trillion to $5 trillion of market capitalization based on current valuations.
While these companies represent exciting growth opportunities, the introduction of such a large volume of new equity supply relative to the S&P 500’s current market capitalization of roughly $70 trillion warrants close attention.
Where major markets stand
Source: FRED, U.S. Treasury, Bloomberg, ICE BofA; market monitor as of May 29, 2026.
S&P 500 Sector Performance Heatmap
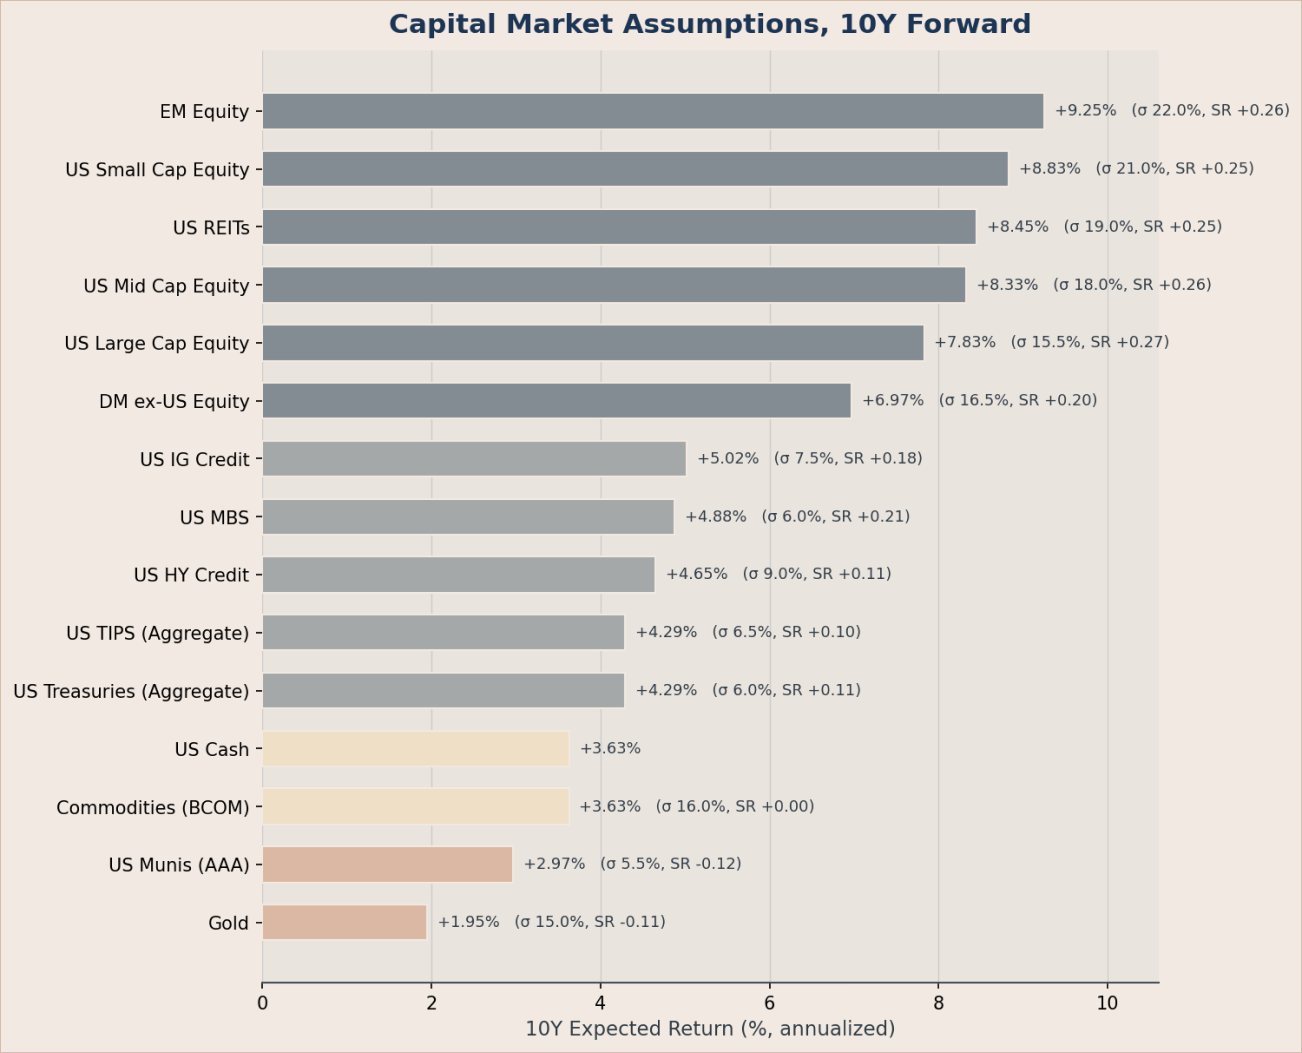
Farther Ten-Year Capital Market Assumptions