The Case of Diversifying Duration
Interest Rate Risk is complex and requires a different approach in portfolio management.
In 1938, an unknown Canadian economist, Frederick Macaulay, published a groundbreaking paper about short selling at the New York Stock Exchange. The thesis centered around interest rates and how those affect the price of a security.
The hallmark of MacCauley’s work became known as an essential formula called “duration.” It is a time-weighted mathematical measure of the relationship between price and interest rates.
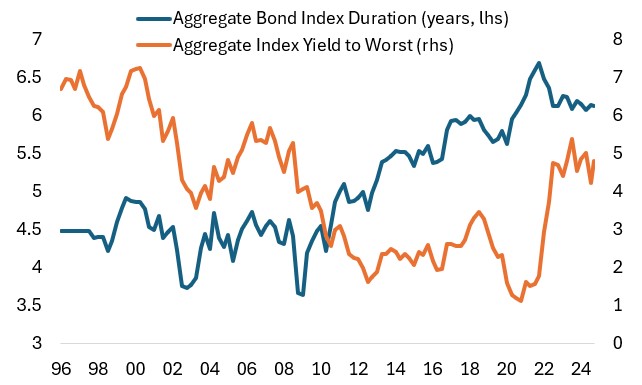
Since interest rates peaked in 1981, the duration of bond indices extended from 3-years to a record 9-years in 2020. The aggregate bond index, which consists of all US fixed-income asset classes, has a duration of more than 6-years with yields two percent below the historical average. The “risk-reward” of bonds as expressed by yield divided by duration is less than 1.0 and indicates higher than normal interest rate sensitivity.
Duration comes in several forms.
The “effective duration” considers a bond’s yield, coupon, maturity, call features, and the expected change in cash flow due to interest rate changes. The “modified duration” measures the Macauley duration divided by the yield to maturity to express interest rate sensitivity.
There are other types, such as “spread duration,” which is the change in the prices of a bond as it relates to the change in spread. Another sophisticated way is “yield curve duration,” which affects the price when the shape of the curve changes.
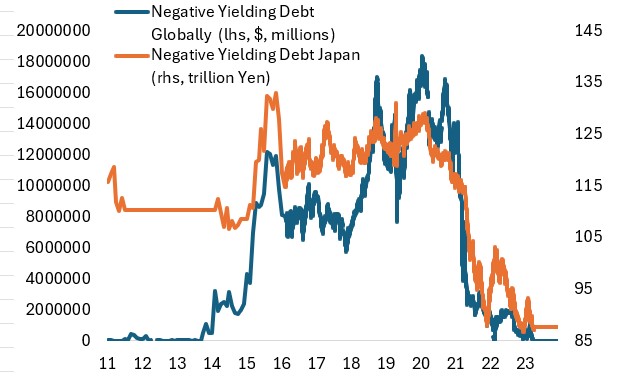
Investors must consider these mathematical measures as the paradigm of low to negative yields has shifted to a higher rate regime. By 2020, more than $18 trillion of the global aggregate index was trading at negative yields. Over $5 trillion of corporate debt had negative interest rates at the height.
Bonds may feel the echo of the dot-com version of negative yields, which may result in a ‘lost decade’ for Treasuries. The reversal is in motion, and the risk-reward must improve for bonds to stabilize.
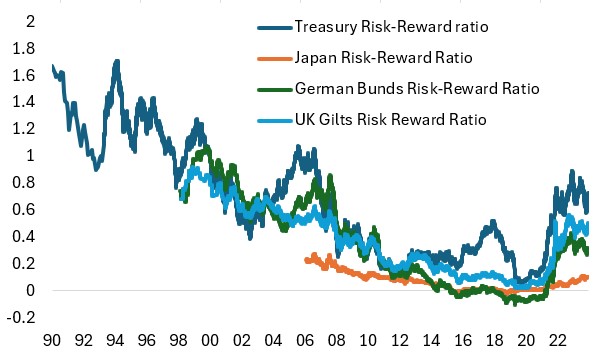
The bond risk-reward ratio is the yield divided by the duration, which measures the relationship between rates and price.
The ratios have improved but remain below the historical average of 1.0, when interest rates ‘peaked’ and the Fed started cutting rates. Investors are not getting enough yield bang for the duration buck, which means the whipsaw risk is high.
Even though long-maturity bonds trade below par, the risk-reward ratios indicate lower bond prices. The reason is duration, which is riskier than ever before. Portfolios must diversify duration to weather sudden interest rate volatility.
With less reward and more risk, bond duration has become a risk factor in 60/40 portfolios and asset allocations. Investors must rethink the positioning through a layered approach of duration against bond indices.
As published by Bloomberg-Barclays, the aggregate index is undiversified because it consists of 45% of Treasuries, 35% of corporates, and the remainder of mortgages. Due to years of quantitative easing, the duration of the index extended to record length.
The bear market of 2022-23, when yields rose by 550 basis points, has shortened the index duration by a marginal amount, leaving investors more exposed to interest rate risk even though yields have ‘normalized’ to pre-GFC levels. Index duration is, on average, 2.5 years longer versus history since 1990. For duration to return to pre-GFC ranges, yields may have to rise by 150 basis points.
While that remains an estimate, the prospect of such a move is realistic in current economic and market conditions. An investor has to select slices of duration to achieve optimal diversification, which is daunting and arduous given the esoteric nature of fixed-income instruments.
Nonetheless, a portfolio diversified with a floating rate, structured credit, emerging markets, global, callable-putable, preferreds, convertible, and step-up coupon durations is likely to have a lower volatility for the same target index duration.
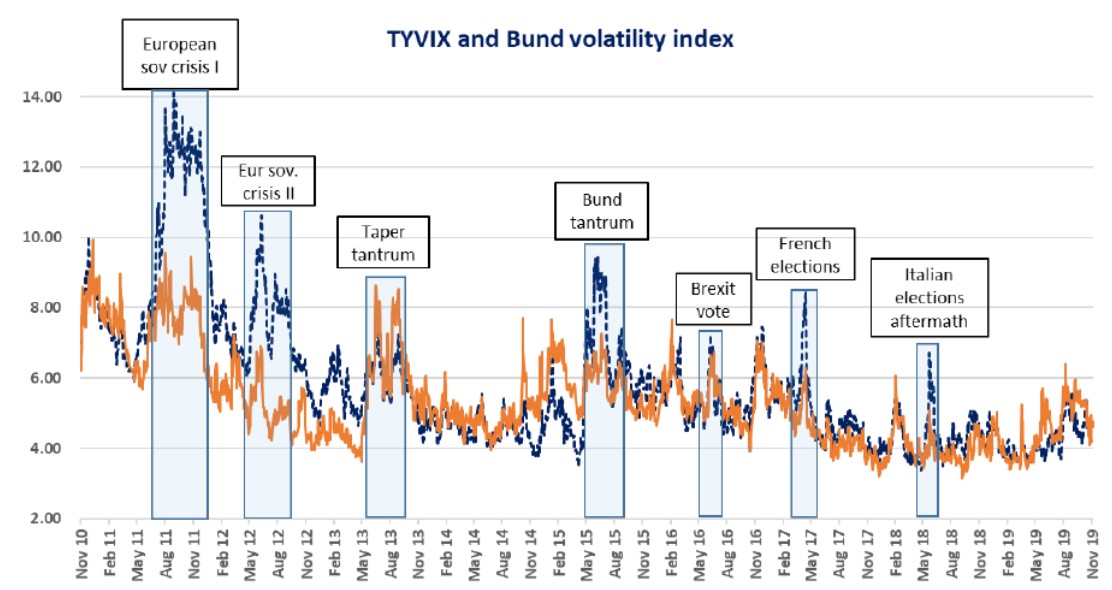
For example, the volatility of an index customized by the mentioned fixed-income asset classes is about half the volatility of the aggregate index, as shown in the graph. There is a clear case for duration diversification given the repeated nature of ‘bond tantrums,’ the sudden jolt in yields.
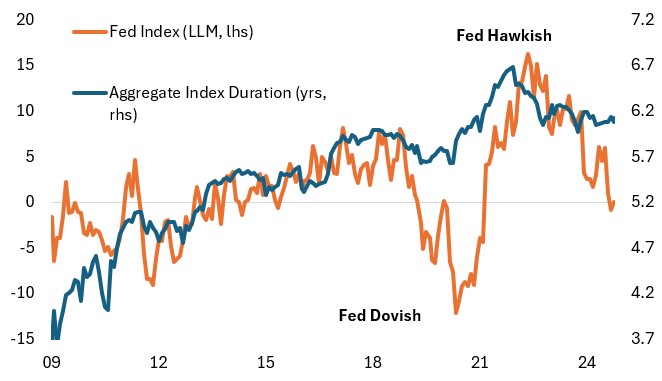
The Fed Index indicates potential “seismic activity” under the bond surface. The effect of monetary policy communication outweighs other fundamental factors, such as non-farm payrolls and consumer prices.
Notably, the Fed Index has a strong relationship with its duration, specifically since the first tantrum in 2013. When the duration of the aggregate index lengthens in maturity as interest rates fall, it coincides with the Fed index flashing a dovish Fed, and conversely.
The Fed Watch duration optimizer keys input from the Fed Index to derive the optimal combination of fixed-income duration to balance equity volatility in strategic asset allocations.

Ben Emons
,