
Market data as of July 31, 2026. Commentary reflects developments through August 5, 2026.
Executive summary
- U.S. stocks treaded water in early July, weighed down by renewed U.S.-Iran fighting, the collapse of a large tech-focused hedge fund, and investor doubts about whether artificial intelligence (AI) spending would pay off.
- Markets rallied at the end of July, with the S&P 500 hitting a new all-time high shortly after the close of the month on August 4th, fueled by strong earnings reports from Microsoft, Amazon, and Alphabet.
- Oil prices surged during July as Iran disrupted shipping in the Strait of Hormuz, pushing up inflation expectations and bond yields. Prices have since pulled back as diplomacy resumed.
- The Federal Reserve (Fed) held its benchmark interest rate steady at its July 29th meeting, but three members voted for a hike in the first such dissent since 2016. Chair Warsh signaled no tolerance for inflation above 2%.
- The biggest risk we see is rising long-term interest rates, which could slow borrowing, business investment, and ultimately corporate profits.
The big picture: A rough start fueled by geopolitics and a hedge fund collapse
U.S. stock markets were volatile for most of July, pressured by renewed U.S.-Iran fighting, uncertainty over Fed policy, the collapse of a large technology-focused hedge fund, and growing investor doubts about the financial returns from artificial intelligence (AI) spending.
The month began with a sharp sell-off in high-flying tech and chip stocks. Situational Awareness, one of the largest AI-focused hedge funds led by former OpenAI researcher Leopold Aschenbrenner, collapsed from $45 billion to around $10 billion in assets. The fund was forced to unwind large concentrated positions following significant losses, triggering broad selling across the market.1
Market sentiment shifted at the end of July as stronger-than-expected earnings from the major cloud computing companies (Microsoft, Amazon, and Alphabet) showed that some large AI investments are starting to pay off. Forced selling tied to the Situational Awareness collapse also faded, and geopolitical tensions between the U.S. and Iran eased again. Markets subsequently began to rally at the end of July, and carried the S&P 500 Index to a new all-time high shortly after the end of the month on August 4th.
U.S.-Iran Conflict: Oil prices disrupted everything (again)
In last month’s commentary, we discussed the potential end of fighting between the U.S. and Iran, which sent WTI crude oil prices down nearly 20% as commercial shipping resumed through the Strait of Hormuz. Lower energy prices were expected to ease inflation and give the Fed more room to cut interest rates.
However, those expectations changed quickly in July. The month began with Iranian attacks on commercial vessels transiting the Strait of Hormuz. The U.S. responded with renewed airstrikes against Iranian military targets, which escalated into additional Iranian missile and drone attacks against U.S. forces and regional allies. As shipping through the Strait was severely disrupted, Brent crude oil prices climbed approximately 20% during July.
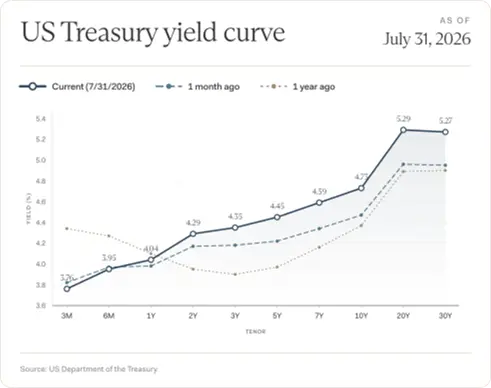
Oil prices remain a critical driver of inflation, interest rates, and Federal Reserve policy. Reflecting these concerns, the 2-year Treasury yield, a short-term interest rate benchmark, rose 0.12 percentage points (12 basis points) during July, while the 10-year Treasury yield rose 0.27 percentage points (27 basis points). The full impact of higher energy prices on inflation is unlikely to show up until August’s official inflation report.
Following the month-end, geopolitical tensions eased once again as President Trump announced that further military action would cease and indicated that the U.S. and Iran were nearing a potential peace agreement. Those comments were reinforced by Treasury Secretary Scott Bessent, who stated on CNBC on August 4th that "there is a chance we may have a deal."
Markets responded favorably. As of August 5th, Brent crude prices had declined roughly 11% from their July highs, while short- and long-term Treasury yields had fallen roughly 0.10 and 0.12 percentage points, respectively.
We have no particular edge in forecasting the likelihood of a lasting peace agreement, and remain skeptical that a durable resolution can be achieved given the region's long history of instability. Nevertheless, we believe the direction of the conflict remains critical for markets. Oil prices directly influence inflation, Fed policy, and ultimately, stock and bond market volatility.
The Federal Reserve’s “family fight”
Fed Chair Kevin Warsh presided over his second policy meeting on July 29th. While the Committee left its benchmark interest rate unchanged at 3.50%–3.75%, three voting members (Cleveland Fed President Beth Hammack, Minneapolis Fed President Neel Kashkari, and Dallas Fed President Lorie Logan) voted for a 0.25% rate increase. It was the first meeting since 2016 in which three Fed presidents dissented in favor of higher rates, reflecting the growing influence of inflation hawks (those who favor raising rates to bring inflation under control) within the Committee.
Chair Warsh emphasized the importance of holding firm to the Fed's 2% inflation target rather than treating it as a flexible range, commenting that the Committee occasionally needs a "good family fight." His remarks suggest a willingness to raise rates further if inflation does not moderate.
The bond market's reaction was unusual. After the meeting on July 29th, the 2-year Treasury yield reversed earlier gains to finish roughly 0.03 percentage points lower at 4.24%, while longer-term yields continued to rise. The 10-year Treasury yield increased 0.07 percentage points, and the 30-year Treasury yield rose 0.11 percentage points to 5.20%, its highest level since June 2007. The post-meeting rise in the 30-year Treasury yield was the largest such move since December 2010.
The upward pressure on long-term interest rates reflects more than Fed policy alone. Growing federal deficits mean the government is issuing more bonds, adding more supply to the long-term bond market and pushing yields higher. At the same time, record bond issuance by major technology companies to finance AI infrastructure (AI hyperscalers) has added further competition for investor capital, contributing to higher long-term borrowing costs.
With Chair Warsh offering few hints about future rate moves and sticking to an approach based on incoming economic data, uncertainty about the timing of future policy changes remains high. We expect Fed policy and long-term interest rates to remain important drivers of both bond and stock market volatility during the second half of the year.
Q2 2026 Earnings season: Big tech delivers the quarter AI skeptics needed
Second-quarter earnings have been exceptionally strong. Through the end of July, approximately 73% of S&P 500 companies had reported results, with corporate fundamentals generally continuing to exceed expectations.
- Revenue surprise: +5.2% (vs. historical average of +1.3%)
- EPS (earnings per share) surprise: +6.0% (vs. historical average of +4.4%)
- Consensus EPS Growth: +28% for 2026; +15% for 2027
- Consensus Revenue Growth: +10% for 2026; +8% for 2027
- Trailing 12-Month Operating Profit Margin (EBIT): 19.4%
- Expected Operating Profit Margin (EBIT): 20.4% (2026) and 22.1% (2027) 2
We believe the defining story of earnings season has been the strong results from the major cloud computing companies. Investors have increasingly questioned whether the enormous sums being spent by the AI hyperscalers would ultimately generate acceptable returns. Microsoft's and Amazon's earnings provided solid evidence that those investments are beginning to pay off.
Microsoft's Azure cloud platform grew revenue 43%, exceeding consensus expectations of 40%, while management guided to an acceleration to 45% growth next quarter. Copilot users also increased to 30 million, well ahead of expectations for 25 million.3
Amazon Web Services similarly beat expectations, delivering 37% revenue growth versus consensus estimates of 31%. AWS also expanded operating profit margins by roughly 5 percentage points to 38%, showing the efficiency gains that can come with greater scale. Amazon's $496 billion in contracted future business further supports a multi-year growth outlook for its cloud division.4
Alphabet’s Google Cloud also delivered impressive results. Revenue rose $4.7 billion quarter-over-quarter to $24.8 billion, topping consensus expectations of $22.5 billion, while operating profit margins expanded 2.7 percentage points to 35.6%.5
Importantly, all three companies indicated that demand continues to outpace available capacity, suggesting that additional spending could support further revenue acceleration. Together, Microsoft, Amazon, and Alphabet generated roughly $13 billion in quarter-over-quarter revenue growth, while simultaneously expanding profit margins, providing real confirmation that AI-related capital spending is producing measurable financial returns.
Meta continues to invest aggressively in AI but has yet to show a comparable return on that spending. Management has outlined numerous long-term AI initiatives, but investors continue to demand greater evidence that these expenditures will translate into sustainable earnings growth. As a result, Meta has lagged behind many of its mega-cap tech peers (the so-called “Magnificent Seven”) and currently trades at a lower valuation than most of them.
The four major cloud companies now expect to spend roughly $750 billion on capital investment during 2026, up from prior guidance of roughly $700 billion, representing approximately 80% year-over-year growth. Early commentary also suggests further spending increases are likely in 2027.6
Continued AI infrastructure spending supports employment, construction, chip demand, power generation, and data center investment. As long as this investment cycle continues, we believe the probability of a near-term U.S. recession remains relatively low.
Looking ahead: Why long-term rates are the story to watch
In our view, the biggest risk to the current market environment remains rising long-term interest rates. Historically, economic expansions and bull markets have often ended when higher long-term borrowing costs begin to weigh on businesses and consumers.
Accordingly, we remain focused on long-term bond yields, Fed policy, inflation trends, and the sustainability of AI-driven capital spending. These factors are likely to determine whether the current expansion can continue or whether tighter financial conditions begin to slow economic growth and weigh on stock valuations.
Market returns
| Series | Last | YTD % | 1Y % | 1M % | 3M % |
|---|---|---|---|---|---|
| WTI crude (front) | 84.67 | 47.46 | 22.25 | 21.83 | -19.42 |
| Brent crude (front) | 87.93 | 46.14 | 29.38 | 20.40 | -6.08 |
| Henry Hub nat gas | 2.75 | -25.47 | -11.60 | -16.12 | -0.72 |
| Gold (front) | 4,049.10 | -6.73 | 22.95 | 0.26 | -12.54 |
| Silver (front) | 57.79 | -18.15 | 57.40 | -2.84 | -21.42 |
| Copper (front) | 646.55 | 13.79 | 48.48 | 4.41 | 9.10 |
| BCOM index | 132.05 | 20.39 | 30.51 | 7.21 | -6.02 |
| BCOM energy | 39.76 | 56.87 | 36.43 | 15.20 | -7.91 |
| BCOM agriculture | 58.07 | 8.67 | 8.14 | 5.68 | -0.70 |
| BCOM industrial metals | 176.73 | 8.17 | 27.47 | 3.34 | -0.28 |
| BCOM precious metals | 415.69 | -9.68 | 28.53 | -0.46 | -15.02 |
| Index | Last | YTD % | 1Y % | 1M % | 3M % | 52W Range |
|---|---|---|---|---|---|---|
| S&P 500 (TR) | 7,489.72 | 10.14 | 19.56 | -0.06 | 4.19 | 6238-7610 |
| Nasdaq 100 (TR) | 28,274.20 | 12.38 | 22.58 | -6.59 | 3.17 | 22763-30661 |
| Russell 1000 (TR) | 4,076.38 | 9.93 | 18.94 | -0.35 | 4.20 | 3412-4138 |
| Russell 2000 (TR) | 2,931.34 | 18.85 | 34.18 | -3.03 | 4.99 | 2167-3024 |
| Nasdaq Composite (PR) | 25,373.85 | 9.17 | 20.13 | -3.20 | 1.93 | 20650-27094 |
| Dow Jones Industrial (PR) | 52,485.03 | 9.20 | 18.93 | 0.32 | 5.71 | 43589-53056 |
| S&P Mid-Cap 400 (PR) | 3,758.64 | 13.72 | 19.27 | -2.44 | 3.26 | 3106-3853 |
| S&P Small-Cap 600 (PR) | 1,768.56 | 20.49 | 31.48 | -1.98 | 5.94 | 1323-1804 |
| MSCI EAFE (TR) | 3,176.14 | 11.59 | 24.33 | 1.96 | 5.15 | 2606-3180 |
| MSCI Emerging Markets (TR) | 1,665.89 | 20.04 | 36.44 | -3.07 | 4.82 | 1226-1803 |
| MSCI World (TR) | 4,847.88 | 10.26 | 20.41 | 0.51 | 4.33 | 4023-4879 |
| MSCI ACWI (TR) | 1,120.51 | 11.33 | 22.11 | 0.08 | 4.40 | 917-1137 |
| Nikkei 225 (PR) | 64,362.02 | 27.86 | 56.71 | -8.14 | 8.56 | 40291-72386 |
| Topix (PR) | 4,003.30 | 17.43 | 36.02 | 0.21 | 7.41 | 2916-4102 |
| FTSE 100 (PR) | 10,868.05 | 9.43 | 19.00 | 3.53 | 4.71 | 9069-10911 |
| DAX (PR) | 25,629.24 | 4.65 | 6.50 | 2.53 | 5.50 | 22301-25818 |
| Euro Stoxx 50 (PR) | 6,358.01 | 9.78 | 19.51 | 0.47 | 8.10 | 5166-6413 |
| Hang Seng (PR) | 25,884.43 | 0.99 | 4.49 | 13.13 | 0.42 | 22672-27968 |
| Shanghai Composite (PR) | 3,832.26 | -3.44 | 7.25 | -6.40 | -6.81 | 3560-4243 |
| India NIFTY 50 (PR) | 24,383.60 | -6.68 | -1.55 | 2.17 | 1.61 | 22331-26329 |
| Bovespa (PR) | 177,999.00 | 10.47 | 33.76 | 3.47 | -4.97 | 132437-198657 |
| Series | Last | YTD % | 1Y % | 1M % | 3M % |
|---|---|---|---|---|---|
| DXY | 99.914 | 1.62 | -0.05 | -1.26 | 1.89 |
| EUR/USD | 1.1527 | -1.86 | 0.98 | 0.92 | -1.74 |
| USD/JPY | 157.40 | 0.44 | 4.41 | -3.17 | 0.52 |
| GBP/USD | 1.3483 | 0.06 | 2.09 | 1.67 | -0.89 |
| USD/CHF | 0.8075 | 1.88 | -0.59 | -0.11 | 3.34 |
| USD/CAD | 1.4021 | 2.16 | 1.19 | -1.23 | 3.23 |
| AUD/USD | 0.7019 | 5.19 | 9.25 | 1.45 | -2.53 |
| USD/CNY | 6.7531 | -3.36 | -6.21 | -0.50 | -1.10 |
| USD/MXN | 17.3426 | -3.70 | -8.12 | -0.83 | -0.71 |
| USD/BRL | 5.0729 | -7.34 | -9.42 | -1.72 | 2.37 |
| USD/INR | 95.3925 | 6.14 | 8.90 | 0.77 | 0.50 |
| USD/KRW | 1,439.05 | -0.05 | 3.28 | -7.11 | -2.56 |
| Series | Last | YTD % | 1Y % | 1M % | 3M % |
|---|---|---|---|---|---|
| Bitcoin (USD) | 62,899.25 | -28.24 | -46.01 | 7.26 | -17.74 |
| Ethereum (USD) | 1,860.57 | -37.52 | -50.18 | 18.22 | -17.81 |
Source: Bloomberg; as of July 31, 2026.
Download the July market commentary (PDF)
Disclosures
Source: All figures cited from Morgan Stanley 08/03/2026.
Source: MSFT Earnings/Bloomberg 07/29/2026.
Source: AMZN Earnings/Bloomberg 07/30/2026.
Source: GOOG Earnings/Bloomberg 07/22/2026.
Source: JP Morgan 07/31/2026.
This document is prepared by Farther Finance, Inc. for informational purposes only. It does not constitute investment advice, a solicitation, or a recommendation to buy or sell any security or financial instrument. Farther, its affiliates, and its clients may hold positions in the securities mentioned. No security referenced should be considered a recommendation to buy or sell. All data is sourced from publicly available providers as of July 31, 2026. Past performance is not indicative of future results. All investing involves risk, including the potential loss of principal. Please discuss your individual circumstances with your Farther financial advisor before making any investment decisions. © 2026 Farther Finance, Inc. All rights reserved.


