
AT A GLANCE · KEY MARKET LEVELS AS OF MARCH 31, 2026
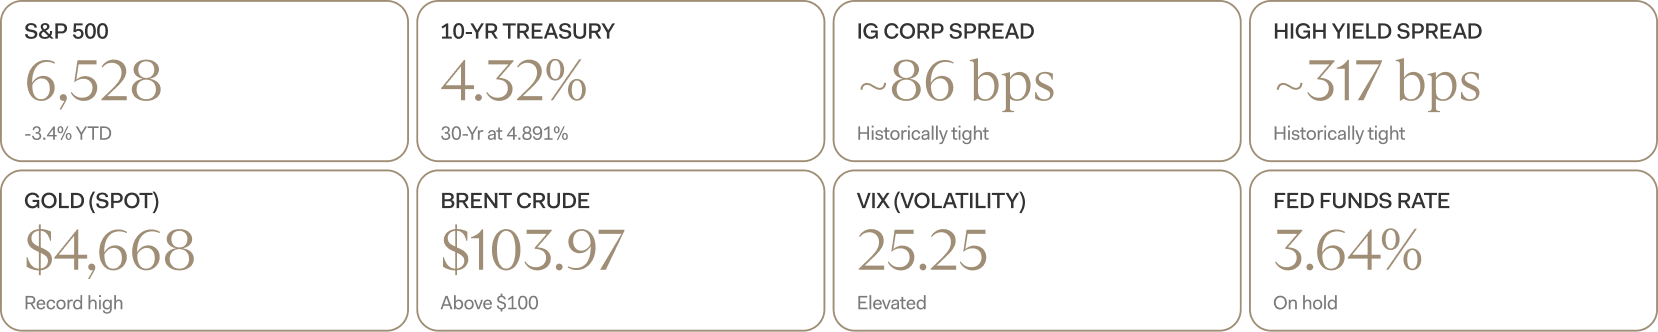
Sources: Yahoo Finance / FT / LSEG
March market update: Geopolitics, commodities, and a shift in the macro regime
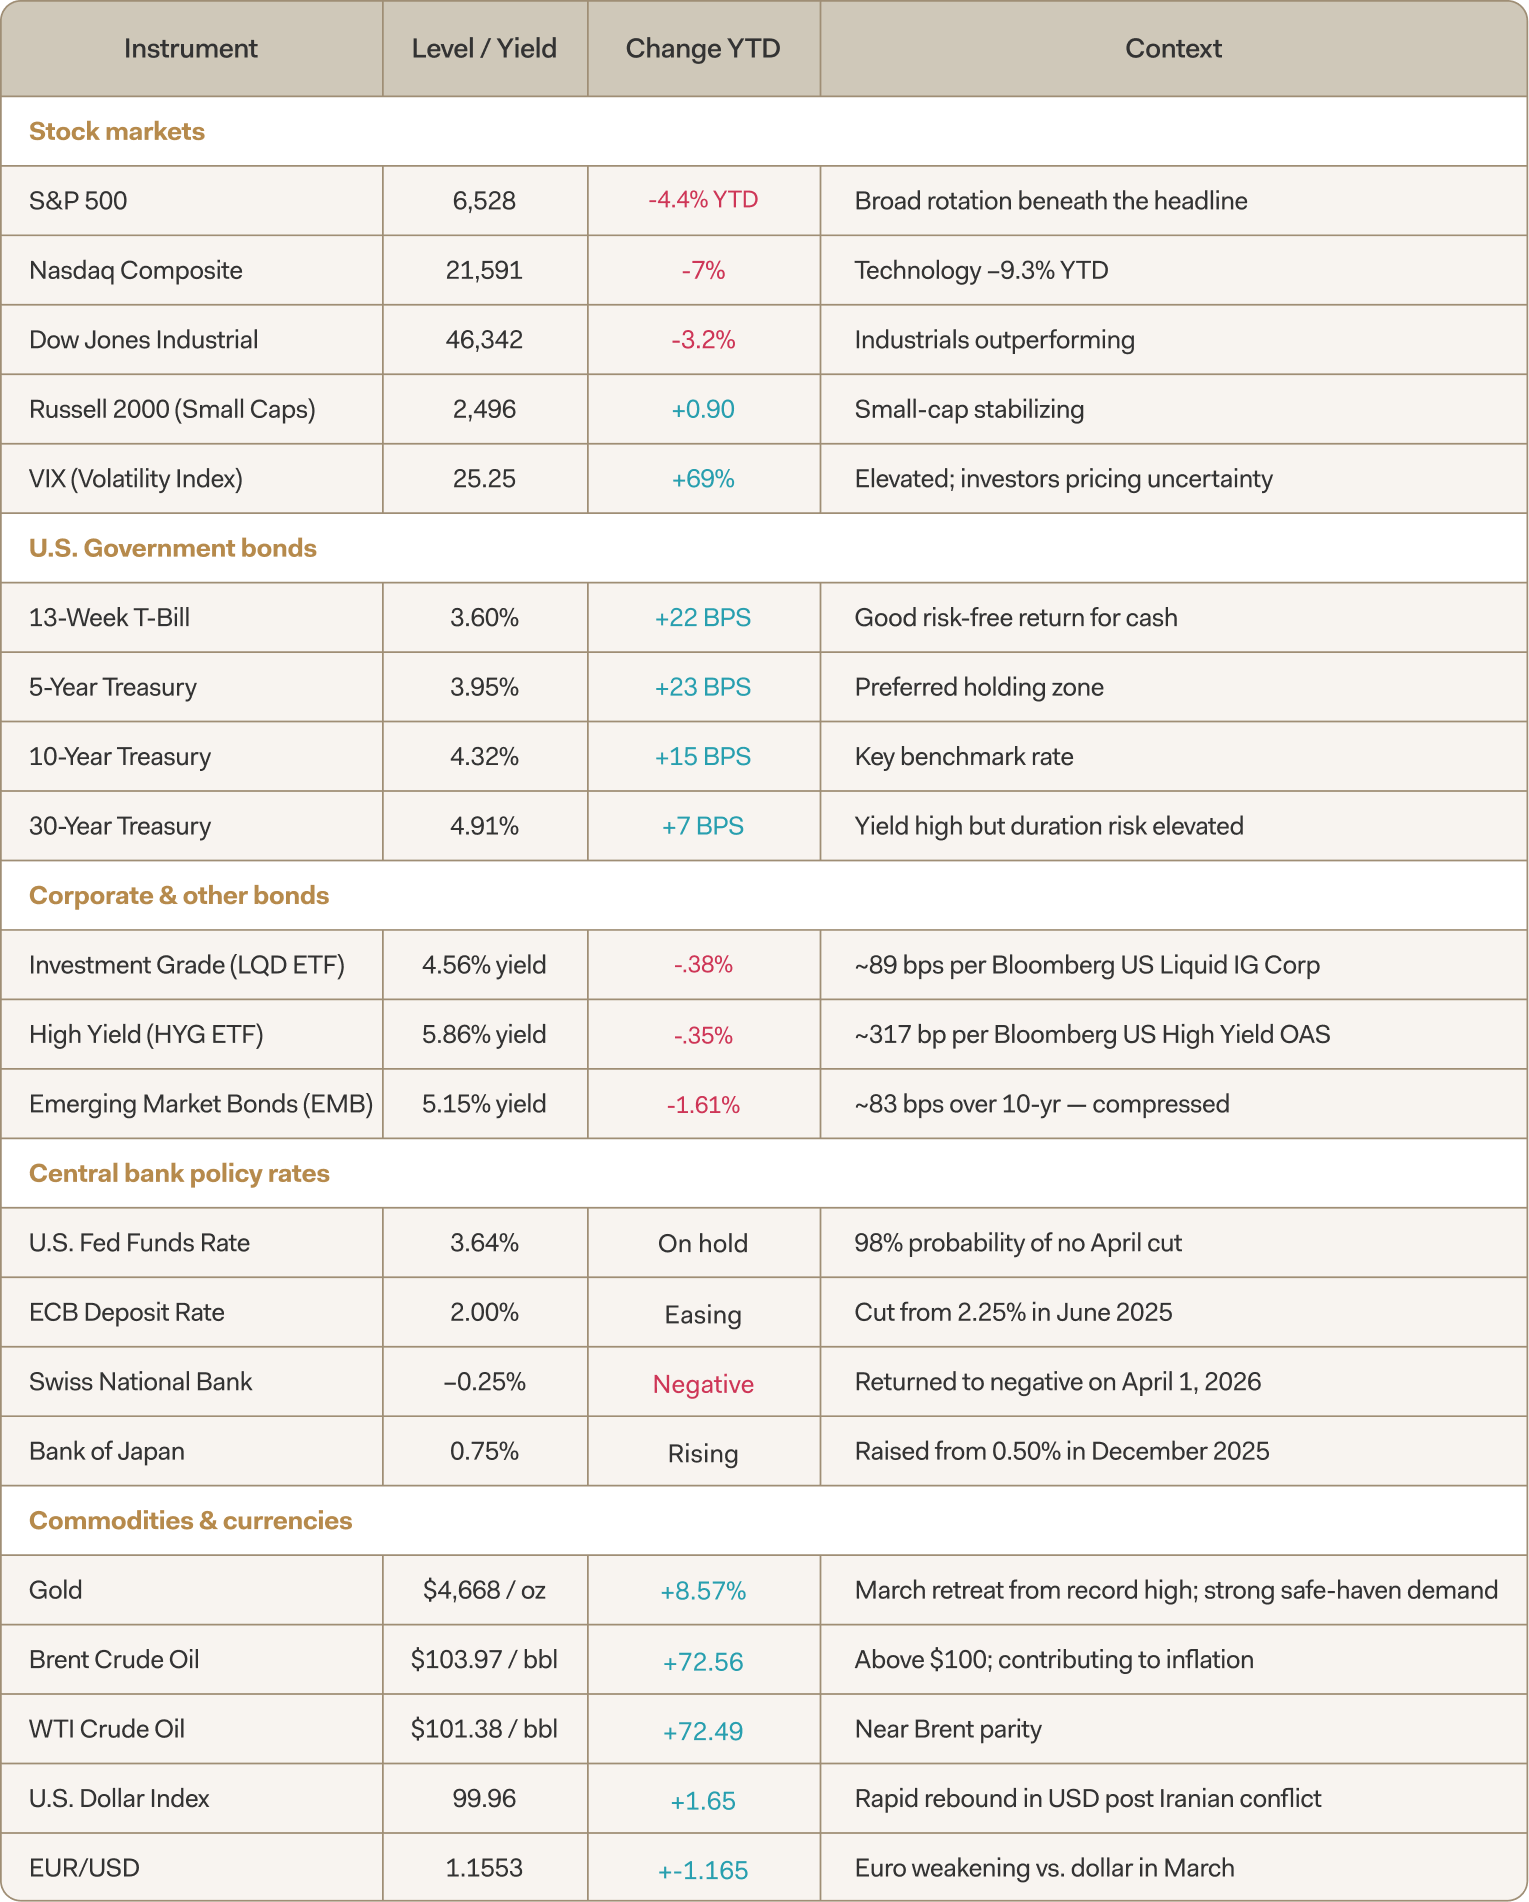
U.S. equities extended their decline throughout March, as market participants increasingly priced in a protracted Iranian conflict and sustained disruptions in the Straits of Hormuz. While the S&P 500 recorded a -4.4% retreat for the month, the headline figure tells only part of the story: the average constituent has corrected approximately 21% from its peak, vastly outpacing the index's -9% decline.1
The deterioration in market breadth was particularly stark. By March 30th, a full 288 members of the S&P 500 had slipped into negative territory for the year — including 65 stocks down more than 20% and 21 down more than 30%.2 March 2026 also marked the most challenging performance for a midterm election cycle since 1942.3
Average stock decline in the S&P 500 is -21%, despite the headline index falling just -9%
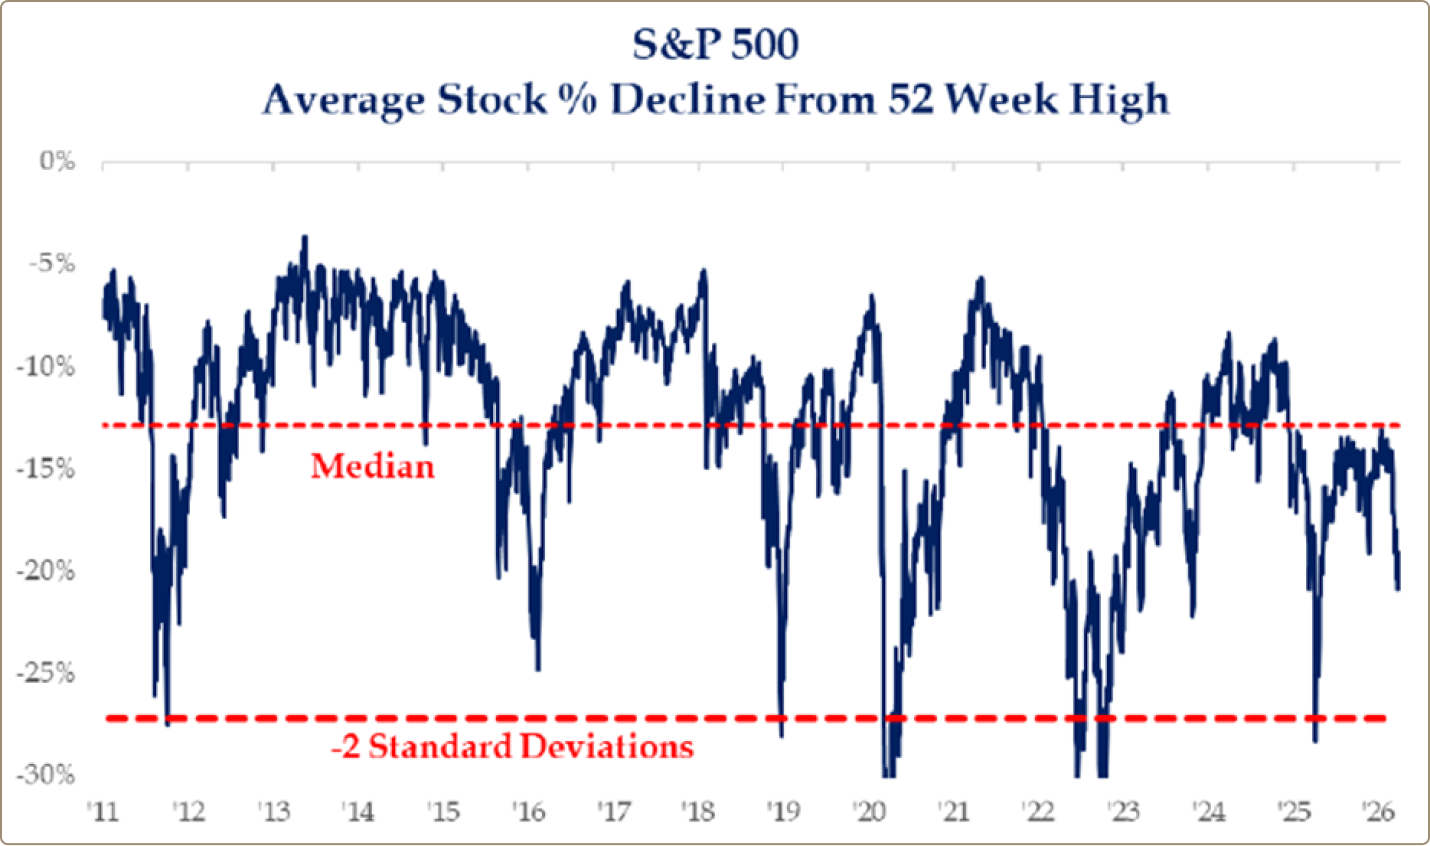
Figure 1: Source: Strategas
This report walks you through the three areas that we believe matter most right now: what's happening in the stock market, what's happening in bonds and credit, and how we think your portfolio should be positioned for the rest of the year.
Some sectors are up 30%. Others are down nearly 10%. Here's the split.
The most important thing to understand about Q1 is that it wasn't a broadly weak market — it was a market in transition. Energy stocks surged over 32%, basic materials gained 11%, and utilities and consumer staples moved higher. Meanwhile, technology, financials, and consumer discretionary — the sectors that dominate most passive index funds — fell between 8% and 10%.
What this means in practice: if your portfolio is heavily weighted toward a broad U.S. index fund, your performance this quarter was dragged down by the sectors with the highest weights, even though most sectors of the economy were actually positive. That's the hidden cost of passive concentration.
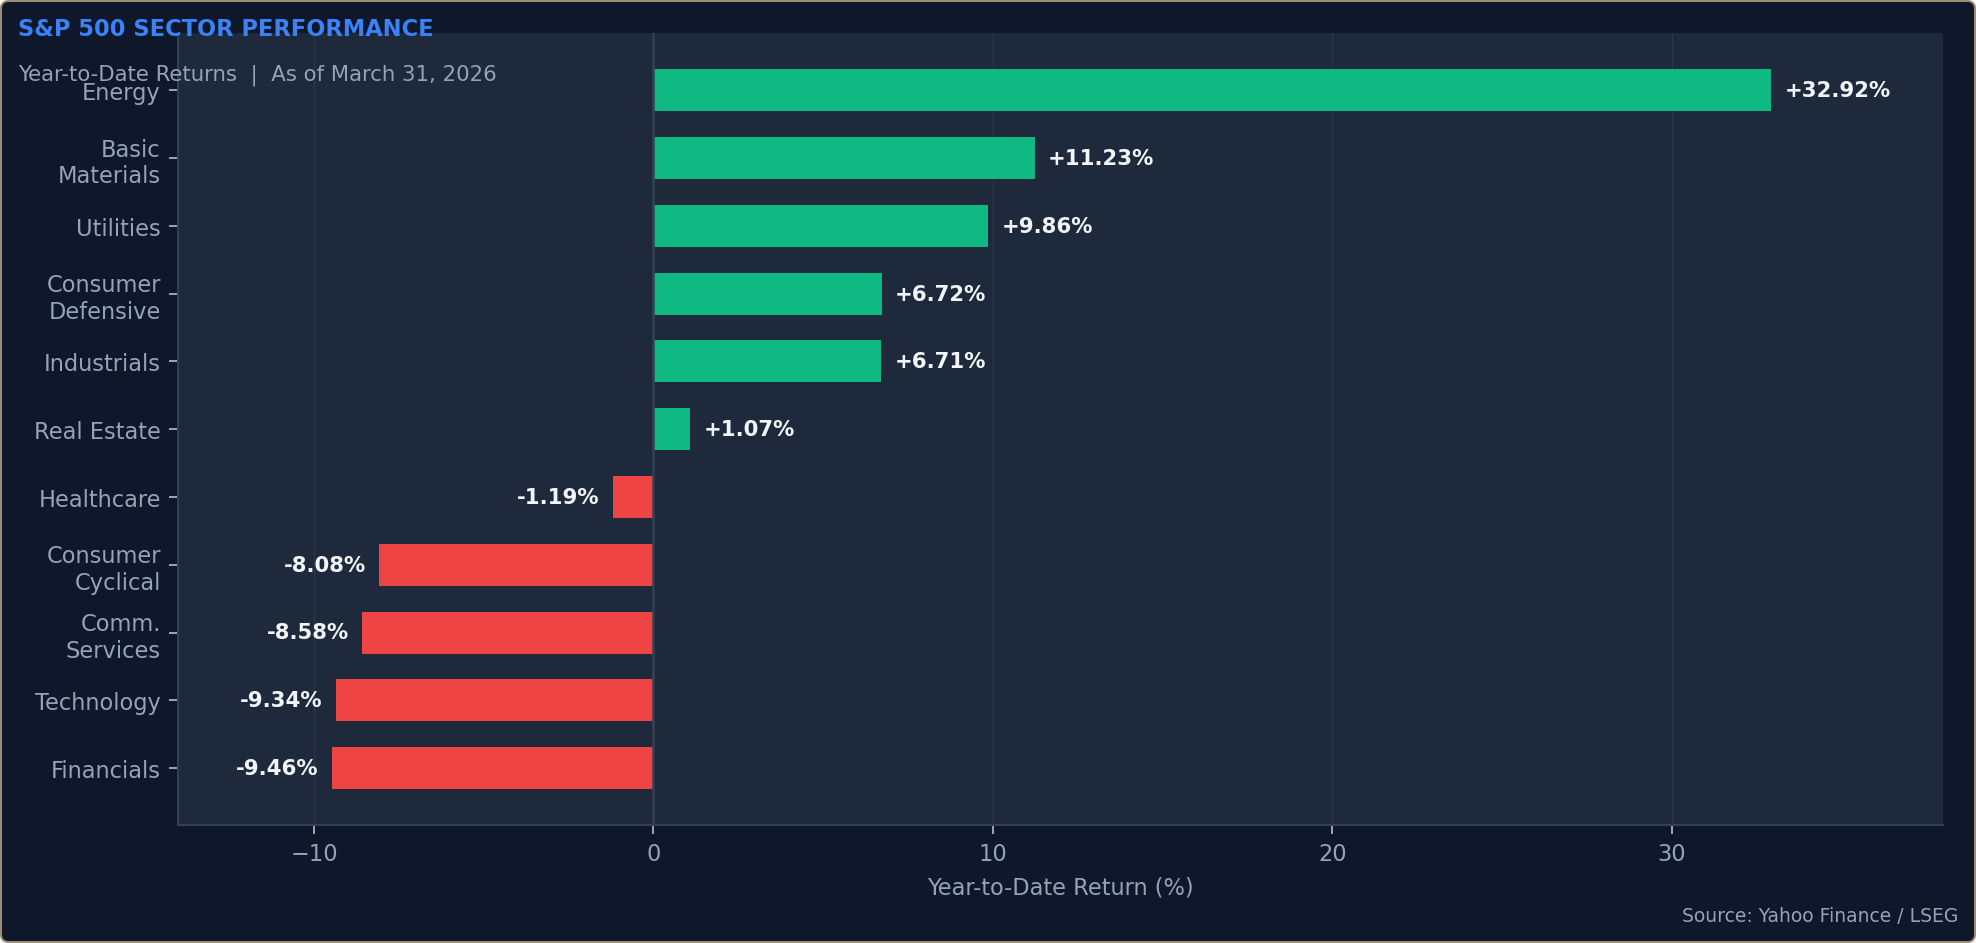
Figure 2: S&P 500 sector year-to-date returns as of March 31, 2026. Source: Yahoo Finance / LSEG.
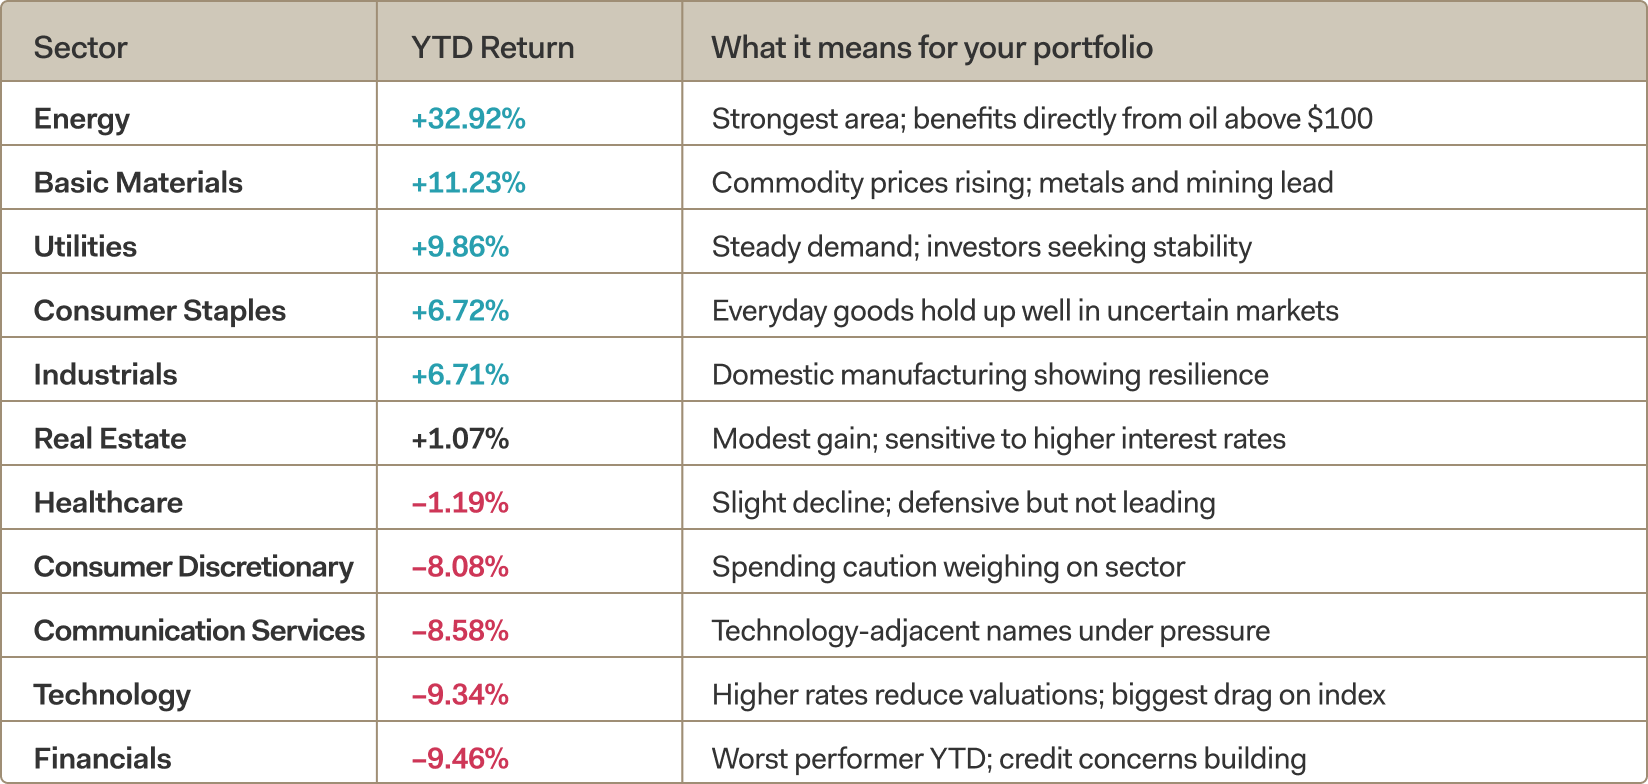
Figure 3: Source: Yahoo Finance / LSEG · YTD returns as of March 31, 2026
International markets have also done better than U.S. large-cap stocks this quarter. European indices are up, supported by lower valuations and a weakening U.S. dollar — which makes overseas investments worth more when converted back to dollars. This is a meaningful opportunity for portfolios that have been exclusively U.S.-focused.
Where was the flight to safety?
One of the more notable developments in March was the breakdown of traditional defensive asset behavior.
- U.S. Treasuries sold off, with the 10-year yield rising approximately 38 basis points, driven by higher inflation expectations and increased fiscal concerns tied to potential wartime spending.
- Balanced portfolios struggled, as rising yields undermined diversification. The iShares Core Growth Allocation ETF (AOR), a proxy for a 60/40 portfolio, declined -4.5% during the month.
- Gold fell 11% in March and remains 17% below its January highs, while silver declined 20% and is now down 38% from its peak.
10-YEAR (RED) & 2-YEAR YIELDS (BLACK) DURING MARCH
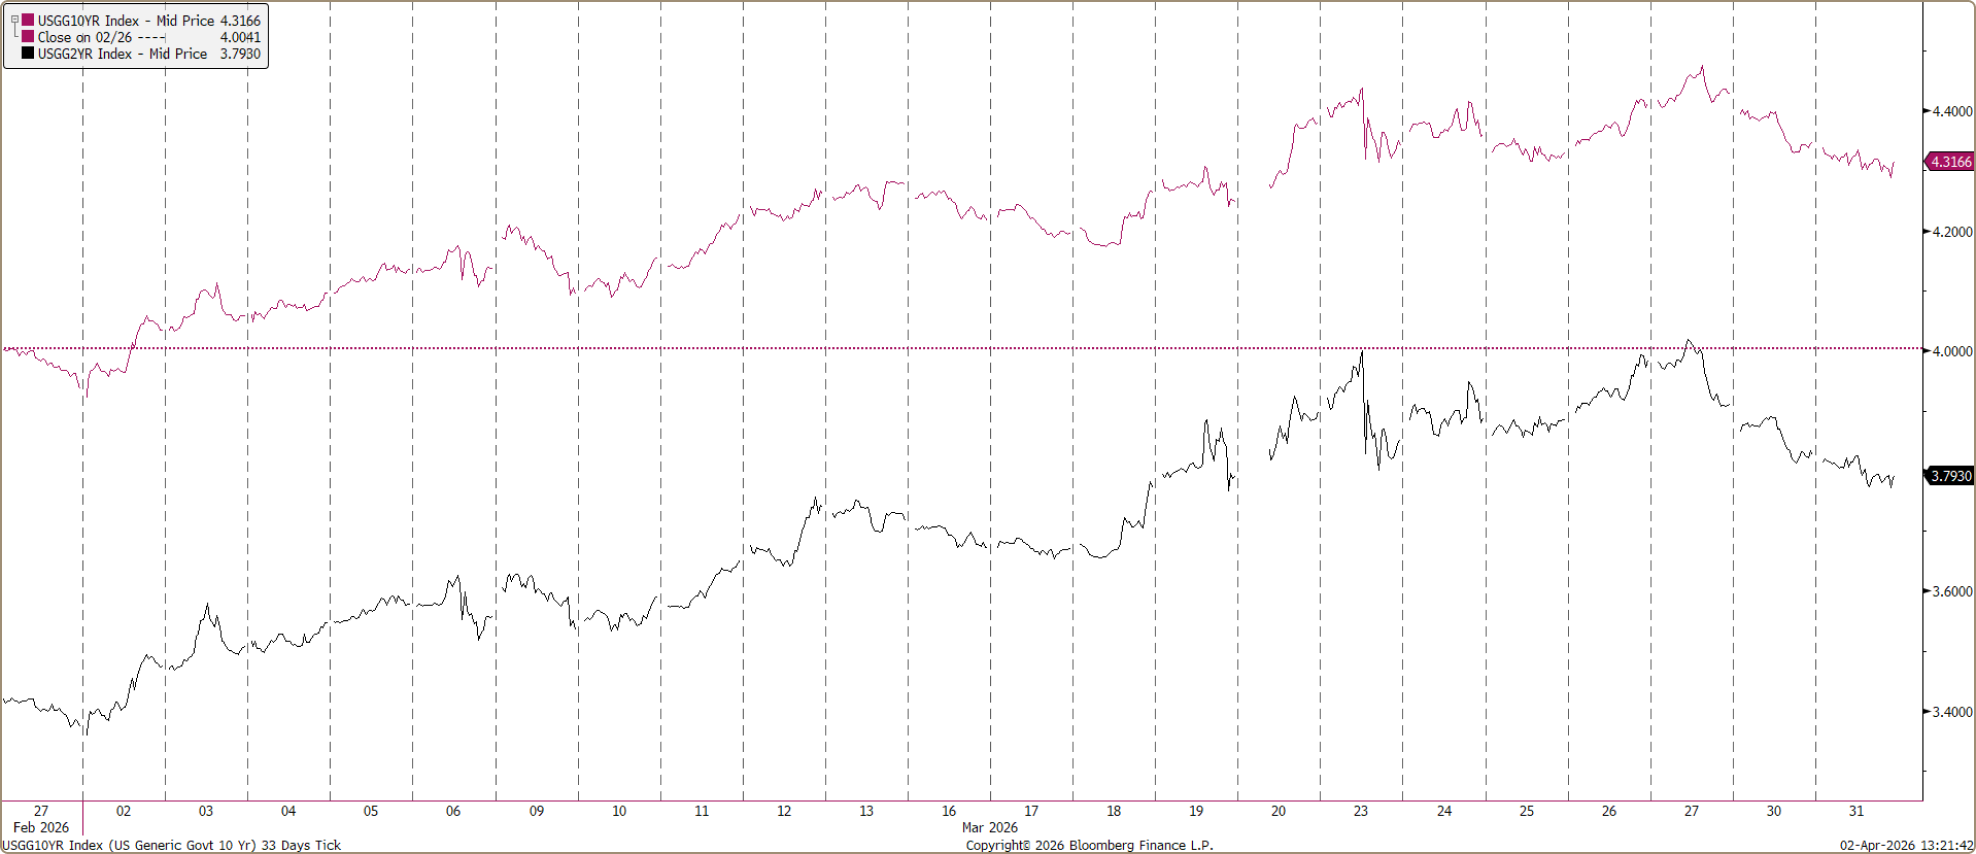
Figure 4: Source: Bloomberg Finance L.P.
This combination of rising commodity prices, higher yields, and elevated inflation expectations has resulted in a meaningful tightening of financial conditions. Yet financial conditions remain both looser than “Liberation Day” (when President Trump announced a broad package of import duties on April 2, 2025) and 2022.
U.S. FINANCIAL CONDITIONS OVER THE LAST 5 YEARS
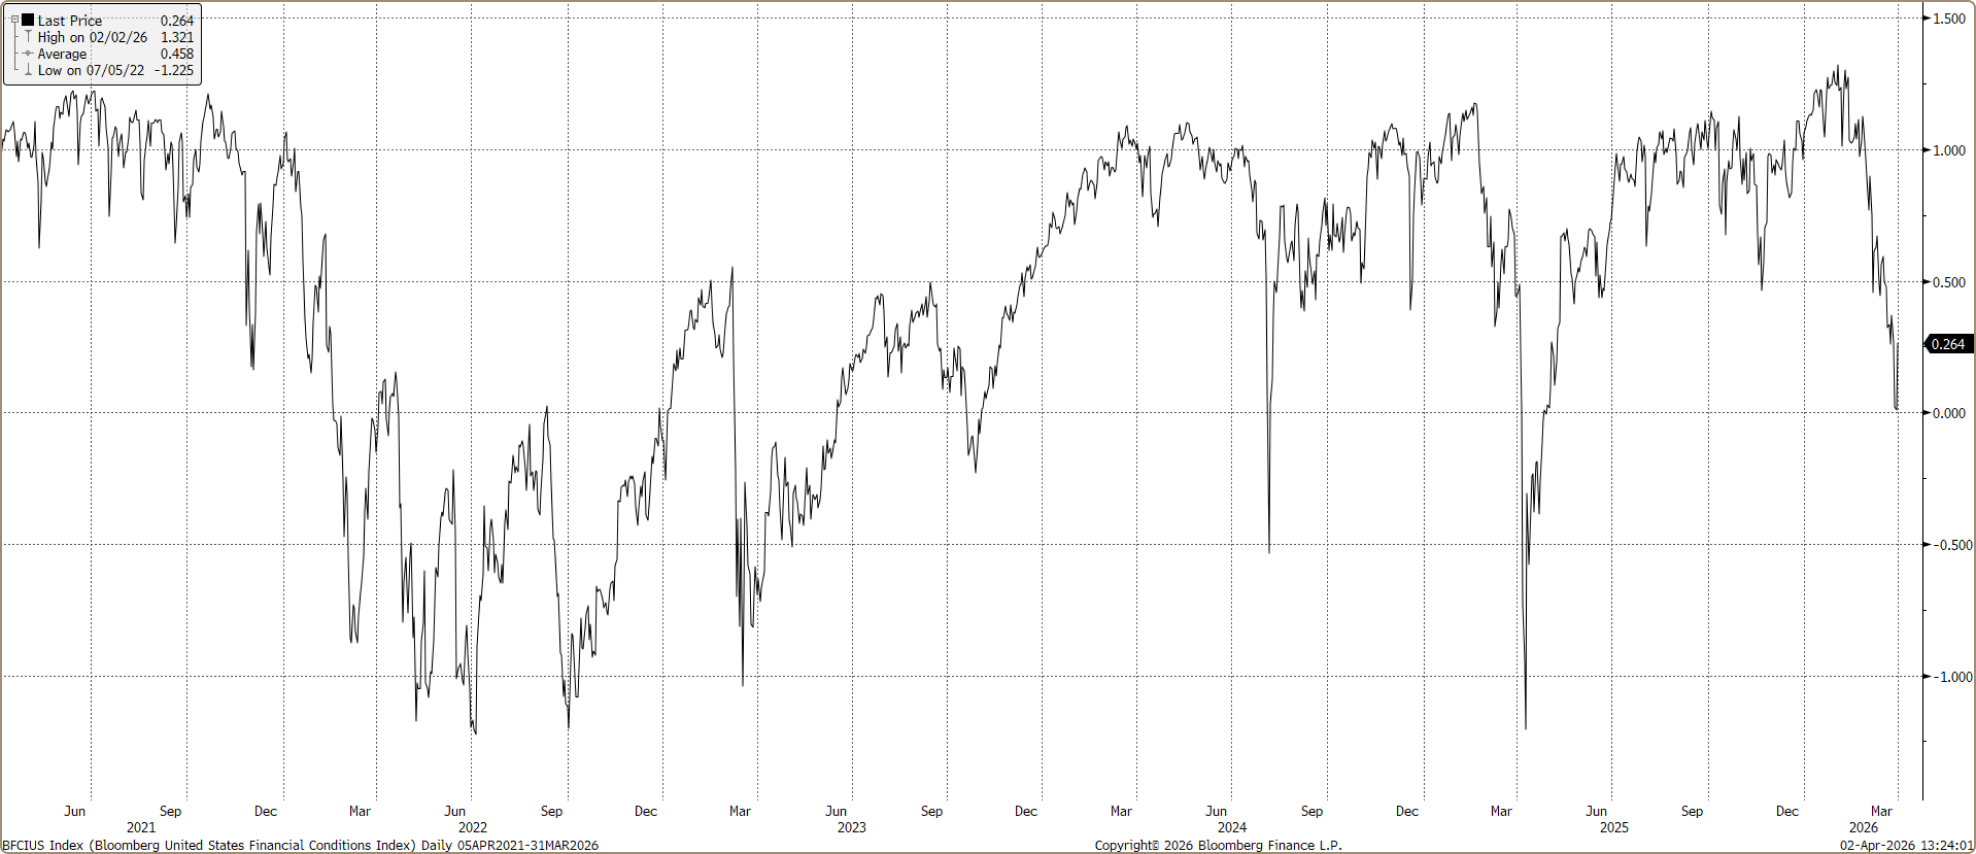
Figure 5: Source: Bloomberg Finance L.P.
Higher oil prices are likely to push headline inflation above 3%, effectively removing near-term Federal Reserve rate cuts from the base case. As a rule of thumb, a $20 increase in oil prices could reduce U.S. GDP by approximately 10 basis points while adding roughly 40 basis points to headline inflation.4
The macro backdrop is increasingly challenging: slower growth, higher fiscal spending, and a less accommodative Federal Reserve. At points during March, markets briefly priced in the possibility of rate hikes—echoing historical policy missteps such as the ECB’s July 2008 rate hike.
Interest rates are high — and staying that way. Here's what to do about it.
The Federal Reserve held rates steady in Q1 and is very likely to do the same at its April meeting. Markets now expect little to no rate cutting in 2026. That's a meaningful shift from the beginning of the year, when many expected three or four cuts. If your bond portfolio was built around the assumption of falling rates, that thesis needs revisiting.
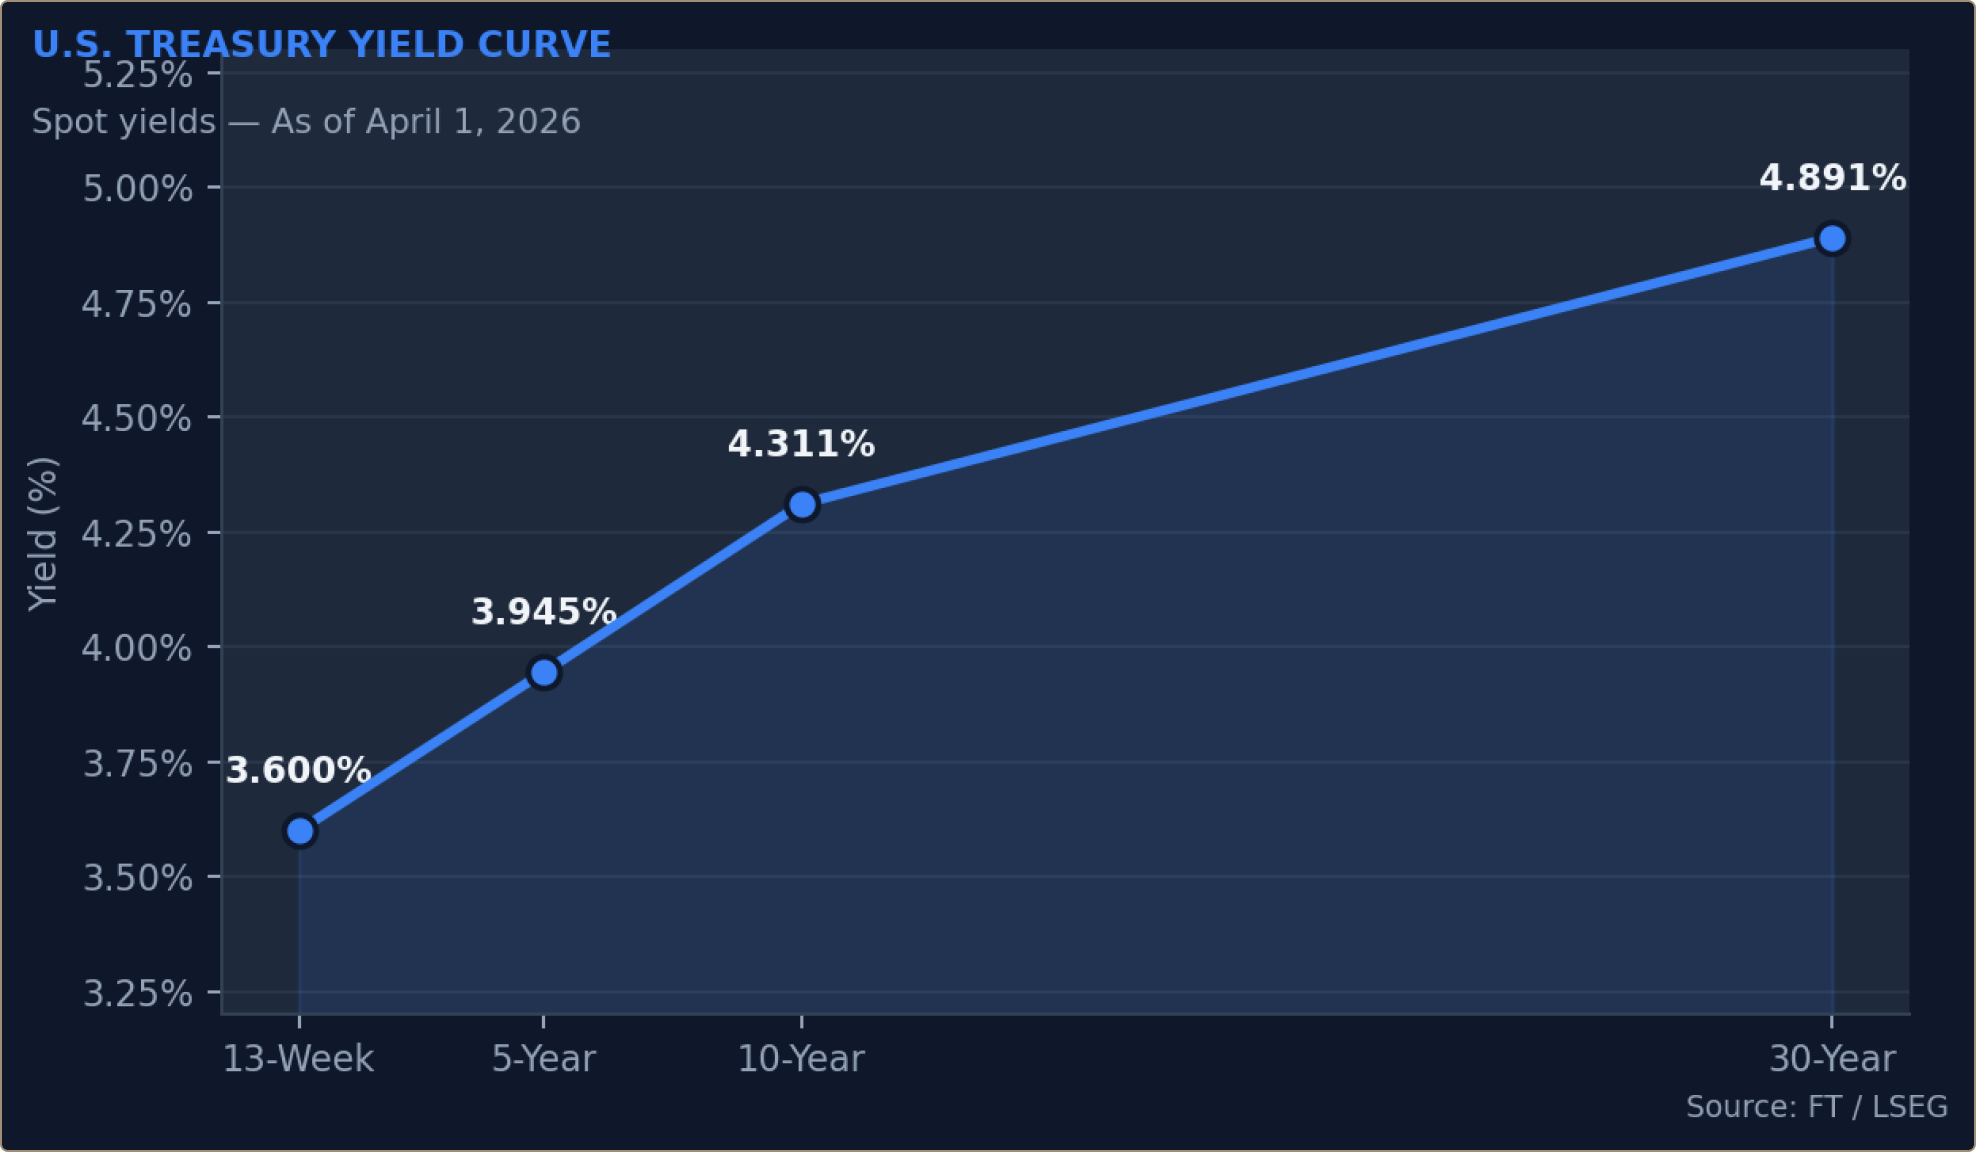
Figure 6: U.S. Treasury yield curve as of April 1, 2026. Source: Yahoo Finance / FT / LSEG.
Today's yield curve tells a clear story: short-term government bonds (yielding 3.60%) are attractive for cash you may need soon, while extending to longer maturities carries more risk than it's being compensated for at current levels. We prefer keeping bond duration in the 2-to-5-year range until there's clearer evidence that inflation is definitively declining.
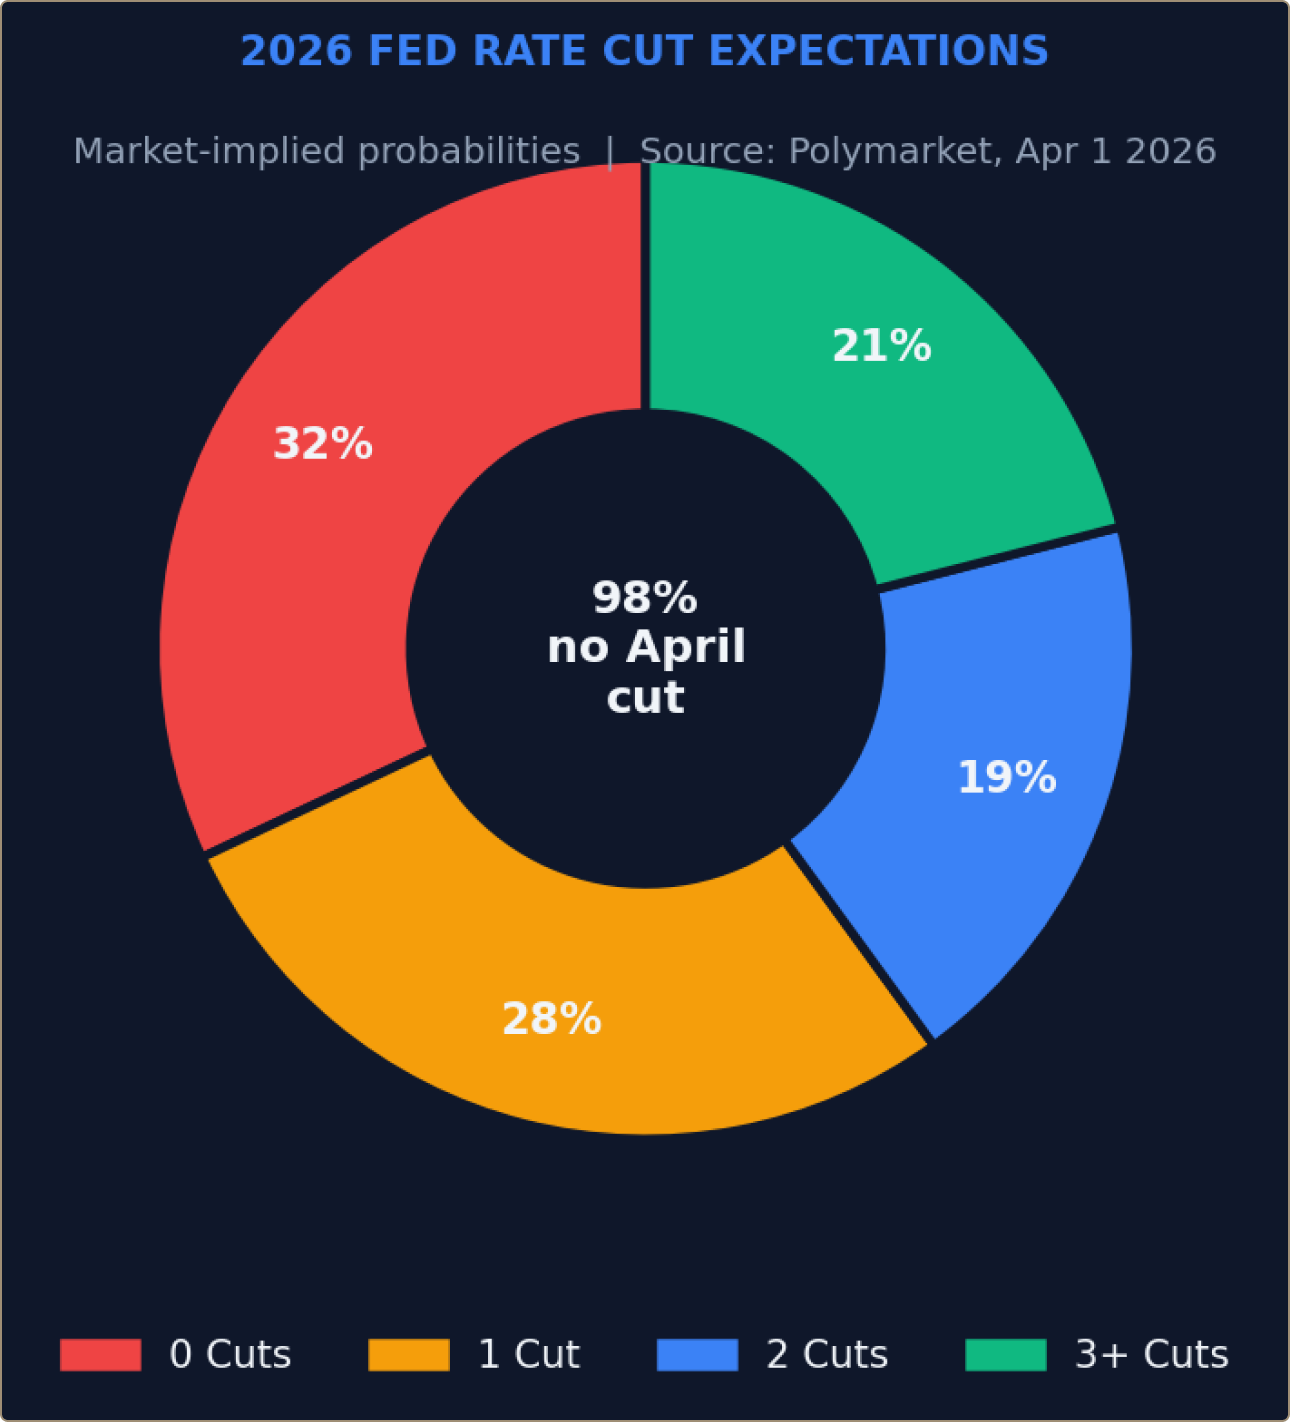
Figure 7: Market-implied probability of Federal Reserve rate cuts in 2026. Source: Polymarket, April 1, 2026.
A warning sign in the corporate bond market
One of the more important — and underappreciated — signals in Q1 came from the corporate bond market. Credit spreads, which measure the extra yield investors demand to hold corporate bonds instead of safe government bonds, are near historically tight levels. In plain English: investors are being paid very little extra to take on corporate credit risk.
This wouldn't be concerning in isolation, but it sits in sharp contrast to the stock market's elevated volatility index (VIX at 25.25 as of 03/31/2026), which shows that equity investors are pricing in genuine uncertainty. When bond markets and stock markets disagree this clearly, one of them will eventually be proven wrong — and history suggests bond markets tend to adjust more abruptly when they move.
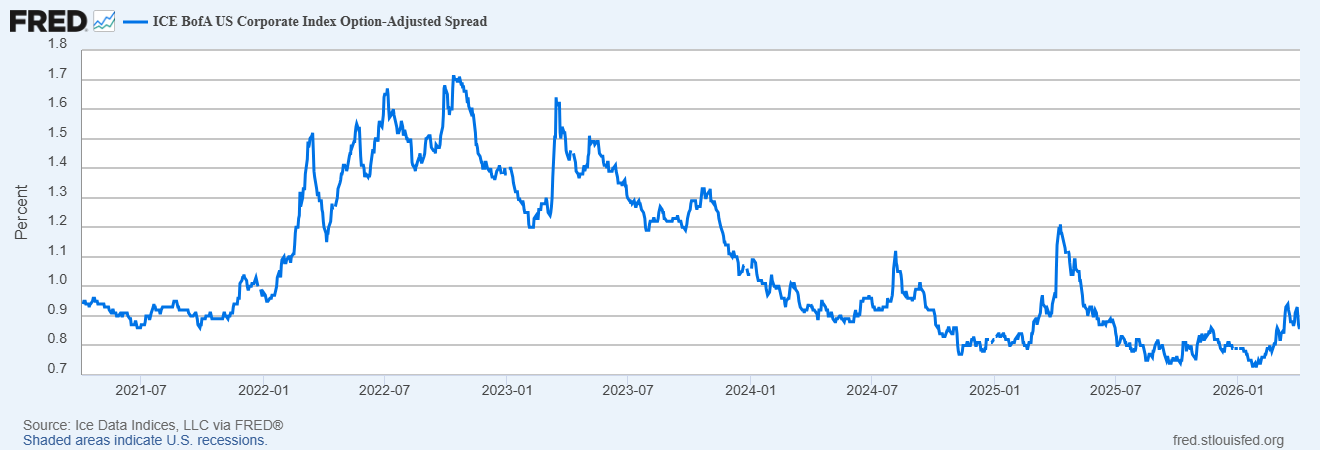
Figure 8: 5-Year Corporate Index Option-Adjusted Spread. Source: Ice Data Indices, LLC via FRED®: fred.stlouisfed.org
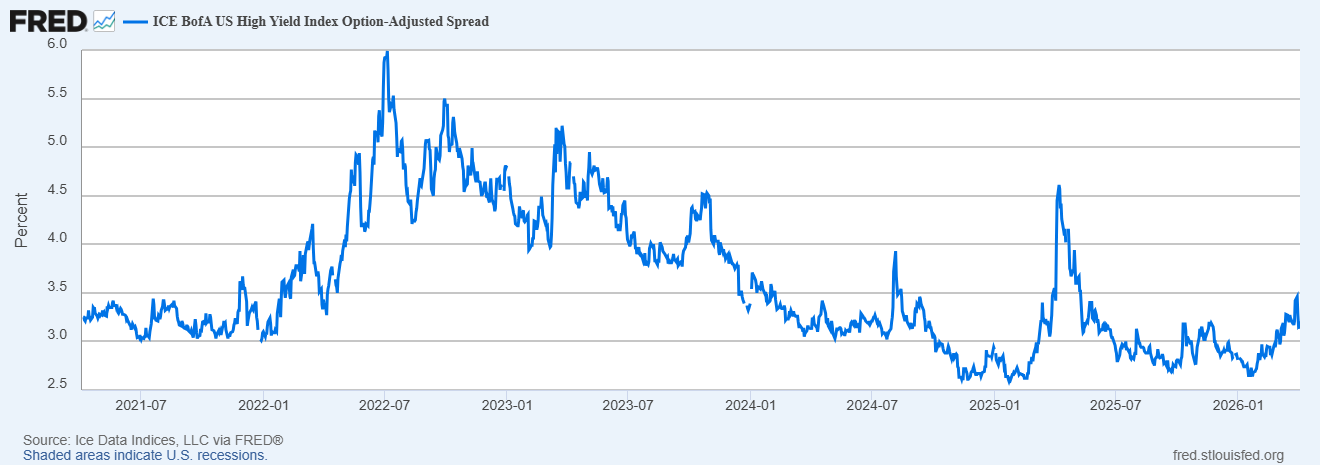
Figure 9: 5-Year High Yield Index Option-Adjusted Spread. Source: Ice Data Indices, LLC via FRED®: fred.stlouisfed.org.
5-YEAR CREDIT SPREAD SUMMARY
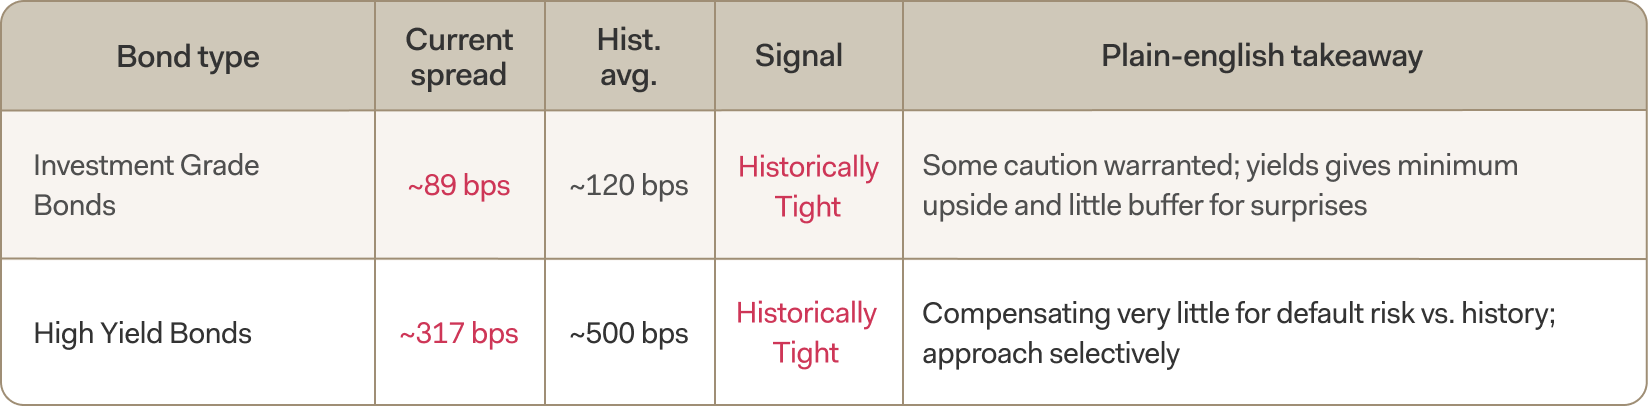
Figure 10: Sources: iShares/BlackRock (LQD, HYG, EMB ETF data); spread figures are approximations derived from ETF distribution yields vs. Treasury yields. Historical averages based on ICE BofA long-run means.
Central banks around the world are moving in different directions — and that creates opportunity
While the Fed holds steady, other major central banks are cutting rates or holding them at very different levels. The European Central Bank has already cut to 2.0%. Most notably, Switzerland's central bank cut its policy rate back below zero on April 1 — the first time a major economy has done so since 2022. Japan, meanwhile, is slowly raising rates after decades at near zero.
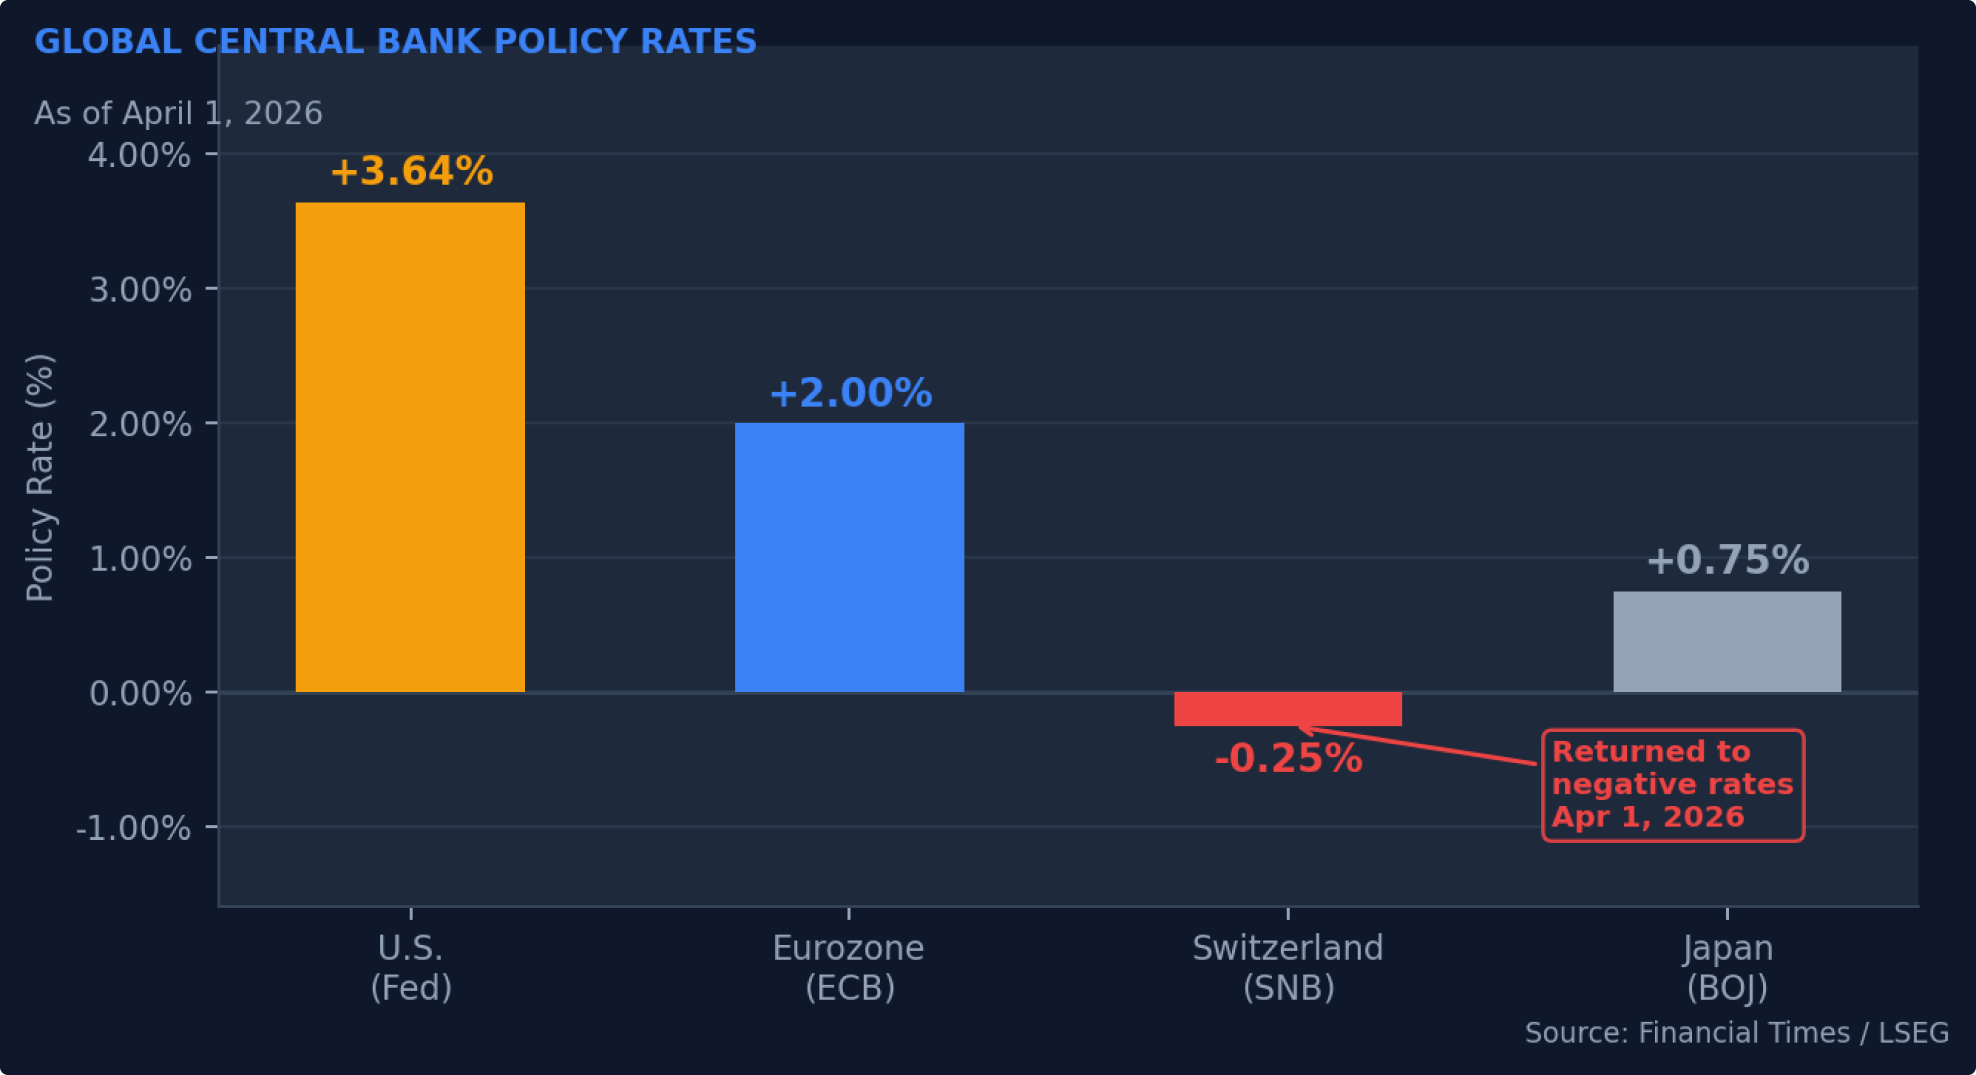
Figure 11: Global central bank policy rates. Source: Financial Times / LSEG, April 1, 2026.
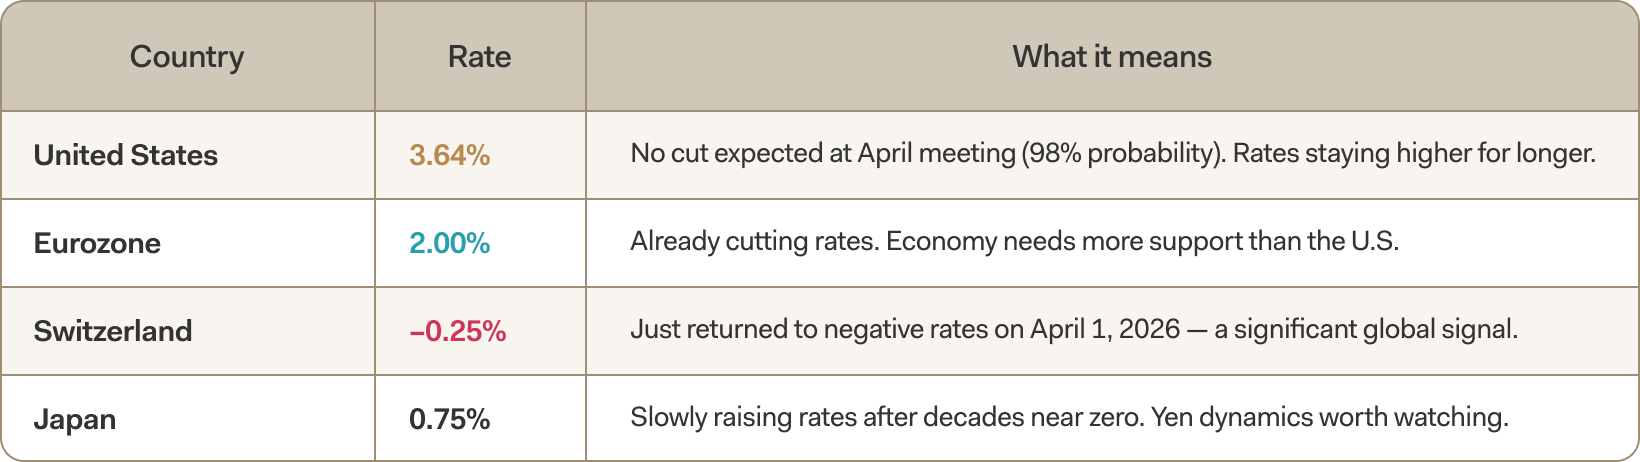
Figure 12: Source: Financial Times / LSEG official interest rates feed · As of April 1, 2026
This divergence matters for your portfolio. When other countries' central banks are cutting while the Fed holds, the U.S. dollar tends to weaken — which is exactly what's happening (the dollar index has slipped to 99.40). A weaker dollar means overseas investments are worth more in dollar terms, reinforcing the case for international diversification.
Oil, gold, and the dollar are sending a consistent message
Three indicators stand out for what they collectively signal. Oil back above $100 a barrel is inflationary — it raises costs across the economy and makes it harder for the Fed to cut rates. Gold at a record $4,784 per ounce reflects investors seeking protection against both inflation and broader uncertainty about the global economy and government finances. And the weakening dollar amplifies the returns on international investments while signaling a shift in how global capital is being allocated.
Taken together, these signals point to an environment where holding too much in U.S. growth stocks and long-term bonds — and too little in real assets, international markets, and shorter-term bonds — leaves your portfolio exposed to risks that are now clearly visible in market prices.
Private Credit: Emerging Stress or Opportunity?
Private credit also came into focus during March. Following earlier stress signals, including the bankruptcies of TriColor and First Brands, the asset class saw a wave of redemption gating across many major alternative asset managers, with the notable exception of Blackstone.
Despite rapid growth — from approximately $1 trillion in 2020 to $2 trillion in 2024—we currently view private credit stress as a manageable risk for the broader financial system.5
That said, periods of dislocation often create opportunity. We plan to engage with leading private credit managers in April to assess whether current market stress is presenting attractive entry points.
The Path Ahead: A Binary Catalyst with Broader Implications
Looking forward, markets are highly focused on a single variable: the resolution of the Iranian conflict and the resumption of trade through the Straits of Hormuz.
Bull Case
- Resolution of the conflict and normalization of shipping flows
- Retreat in commodity prices
- Easing financial conditions
- Re-emergence of rate cut expectations
- Reacceleration of growth-oriented sectors, particularly technology
Valuations have already adjusted meaningfully, with S&P 500 multiples declining approximately 18% to ~20x 2026 earnings and ~17.5x 2027 estimates.
Bear Case
- Persistent energy and commodity inflation
- Elevated inflation expectations limiting Fed flexibility
- Slowing consumer demand (70% of GDP)
- Downward revisions to corporate earnings
Six ways to position your portfolio for the road ahead
These recommendations reflect Farther's current investment strategy view. Your advisor will discuss how each applies to your specific situation, goals, and risk tolerance.
Selectively add U.S. technology and growth stocks
Technology is down ~9% year-to-date, with valuation premiums compressing meaningfully. The sector has historically outperformed in environments where economic growth expectations are moderating. We see an opportunity to selectively add high-quality large-cap technology companies, where valuation premiums to the S&P 500 have narrowed and expectations remain subdued.
Tactically trade energy
Energy’s ~33% year-to-date gain has been driven largely by supply disruptions and an elevated geopolitical risk premium. With oil prices above $100, the sector is generating strong free cash flow while still trading at reasonable valuations relative to the S&P 500. While we remain constructive on the long-term structural outlook for Energy, the current pricing environment reflects a meaningful geopolitical premium. Any resolution involving Iran or normalization of flows through the Strait of Hormuz could lead to a rapid compression in oil prices and a corresponding unwind in sector performance.
Consider taking advantage of the pullback in gold
Gold's recent record high isn't a fluke — it reflects genuine demand for protection against inflation, a weaker dollar, and global uncertainty. Gold and commodity-linked investments serve as a portfolio stabilizer precisely when both stocks and long-term bonds are under pressure.
Shorten the duration of bond holdings; be selective with high-yield
With long-term Treasury yields at 4.89% and the Fed unlikely to cut soon, owning long-dated bonds means taking on significant risk for yields that don't fully compensate. We prefer 2-to-5-year maturities offering yields of 3.80% to 3.95%. On high-yield bonds specifically: the risk premium is near all-time lows, so selectivity matters more than ever.
Cautious near term on International — particularly oil importers
International equities outperformed U.S. large caps in Q1, supported by more attractive valuations and a weaker U.S. dollar. However, this outperformance remains fragile. Non-U.S. markets are more exposed to rising oil prices and have already shown sensitivity to the recent rebound in the dollar.Given elevated geopolitical risks—particularly the ongoing Iran conflict—we maintain a cautious stance on international equities, as further energy shocks or dollar strength could pressure relative performance.
Keep some cash available for opportunities ahead
With markets still uncertain and credit spreads not offering great value in riskier bonds, holding a modest cash position in short-term T-bills (yielding 3.60%) gives you a real return while keeping flexibility to act when compelling opportunities arise. Patience is a strategy.
The market is changing. Your portfolio should reflect that
Q1 2026 was not a market breakdown — it was a market repricing. The investments that worked effortlessly for the past decade are handing leadership to a different set of opportunities. That's not a reason for alarm; it's a reason to be thoughtful.
The clients who navigate this transition most successfully will be those who review their portfolio with fresh eyes, have honest conversations about concentration and risk, and make deliberate adjustments ahead of the crowd — not in reaction to it.
Your Farther advisor is ready to walk through how these themes apply to your specific portfolio and goals. Reach out to schedule a review.
APPENDIX — FULL MARKET DATA REFERENCE
Complete market data used in this report. All figures sourced from Yahoo Finance, Financial Times / LSEG, iShares/BlackRock, and Polymarket as of March 31, 2026.
DATA SOURCES
Yahoo Finance / LSEG
Equity index levels, sector returns, ETF prices and yields (LQD, HYG, EMB), commodity spot prices, VIX, USD Index, and currency rates. Accessed April 1, 2026.
Financial Times / LSEG
U.S. Treasury yields, interbank rates (SOFR), and official central bank policy rates (Fed, ECB, SNB, BOJ). markets.ft.com/data/bonds. Accessed April 1, 2026.
iShares / BlackRock
ETF data: LQD (Investment Grade Corp), HYG (High Yield Corp), EMB (EM Sovereign). Trailing returns as of March 31, 2026.
Polymarket
Prediction market probabilities for 2026 Federal Reserve rate decisions. Accessed April 1, 2026.
References
1. Strategas, March 30, 2026
2. Seeking Alpha, March 30, 2026
3. Strategas, April 1, 2026
4. Crossmark Global, March 9, 2026
5. Crossmark Global March 23, 2026