
In December 1996, Alan Greenspan delivered his now-famous “irrational exuberance” speech at the American Enterprise Institute, cautioning that stock prices might be inflated beyond reasonable value. His remarks highlighted a key tension in markets:
“Clearly, sustained low inflation implies less uncertainty about the future, and lower risk premiums imply higher prices of stocks and other earning assets. We can see that in the inverse relationship between price/earnings ratios and the rate of inflation in the past. But how do we know when irrational exuberance has unduly escalated asset values, which then become subject to unexpected and prolonged contractions as they have in Japan over the past decade?”1
Greenspan’s warning proved prescient—but not immediate. Investors who sold the day after his speech, December 5, 1996, would have forfeited a 105% return before the dot-com bubble ultimately collapsed more than three years later. (Thank you to ChatGPT for the calculation—a fitting reminder that artificial intelligence has been a key driver of valuations in this cycle as well.)
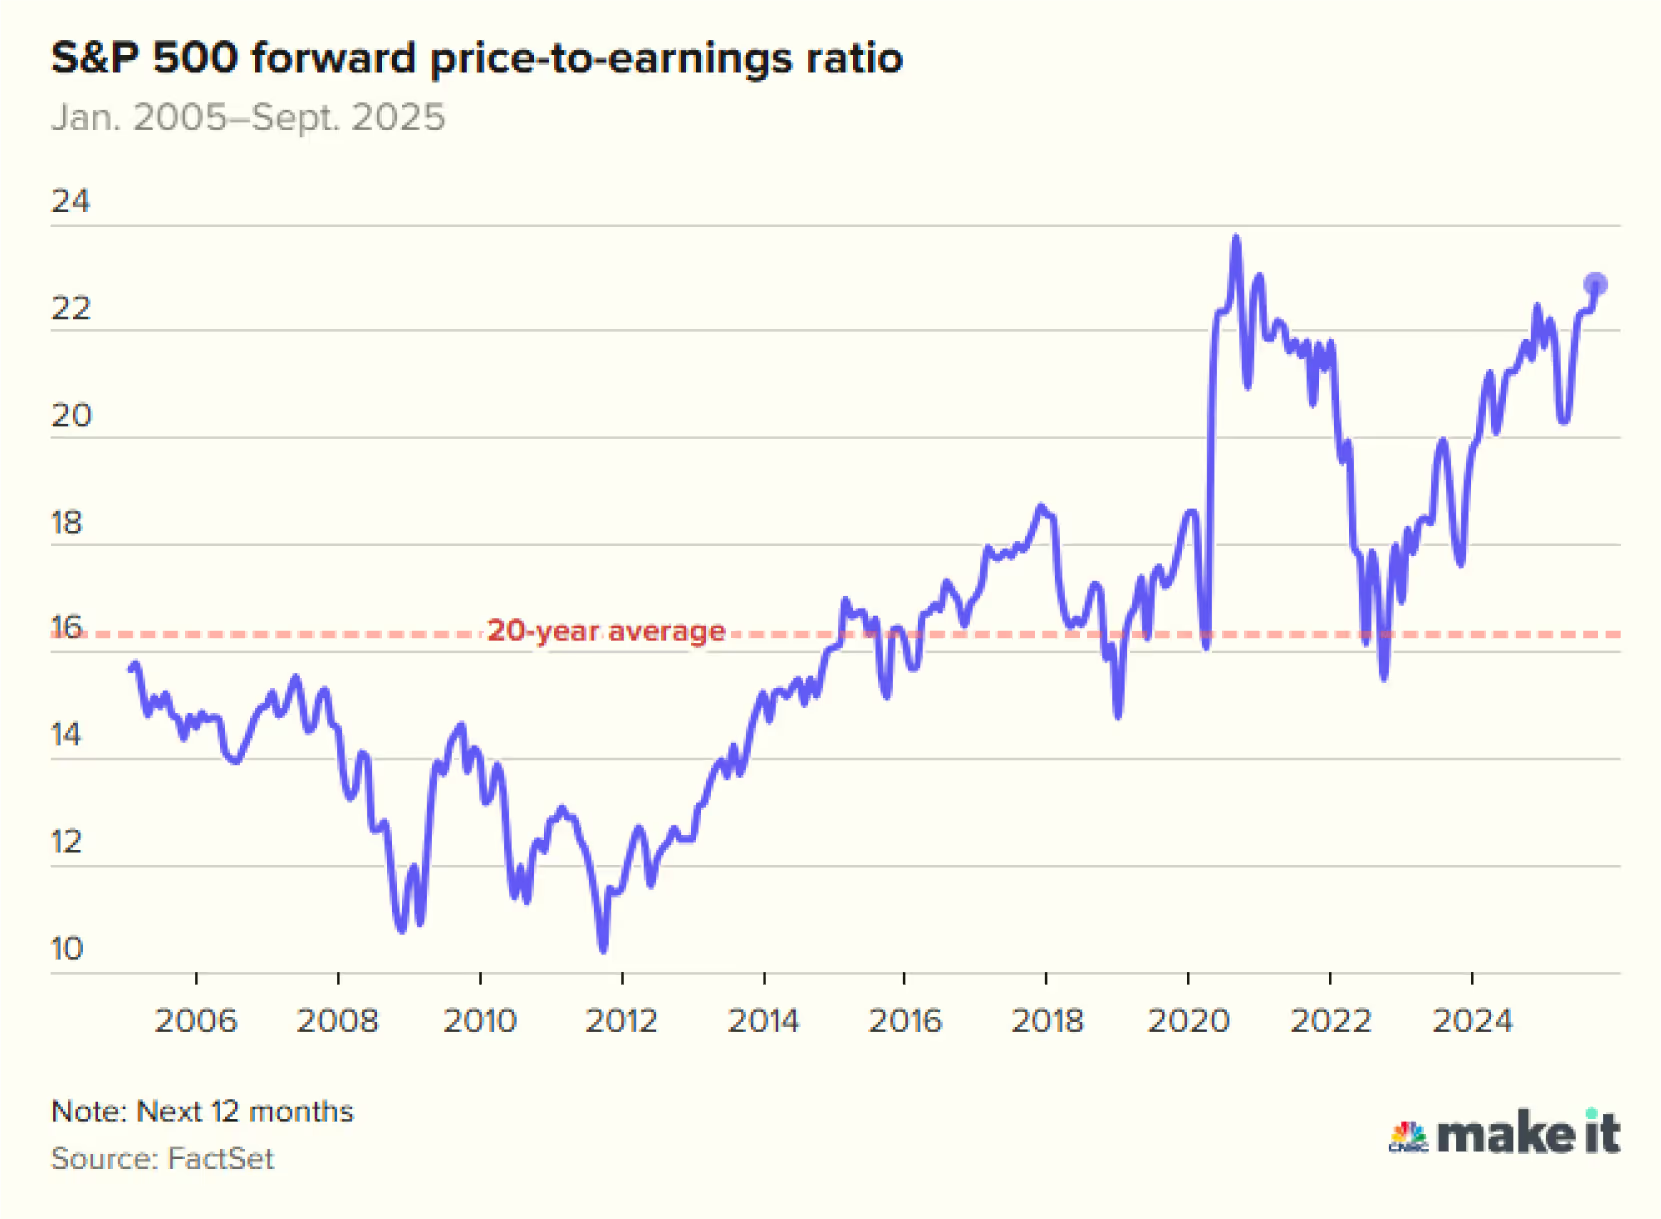
Fast forward three decades, and Jerome Powell evoked memories of Greenspan with his late-September remarks in Rhode Island, acknowledging: “By many measures, for example, equity prices are fairly highly valued.”2
There is no debate that Powell is correct: relative to historical benchmarks, valuations are stretched. The S&P 500 currently trades at a 41% premium to its 20-year average of 16x earnings. But as John Maynard Keynes famously observed, “Markets can remain irrational longer than you can remain solvent.”
History reminds us that identifying a bubble is only half the battle; the greater challenge lies in timing. Markets can and often do defy logic, driven by investor sentiment, speculation, or transformative technologies—such as a current surge in artificial intelligence.
Valuation Debate
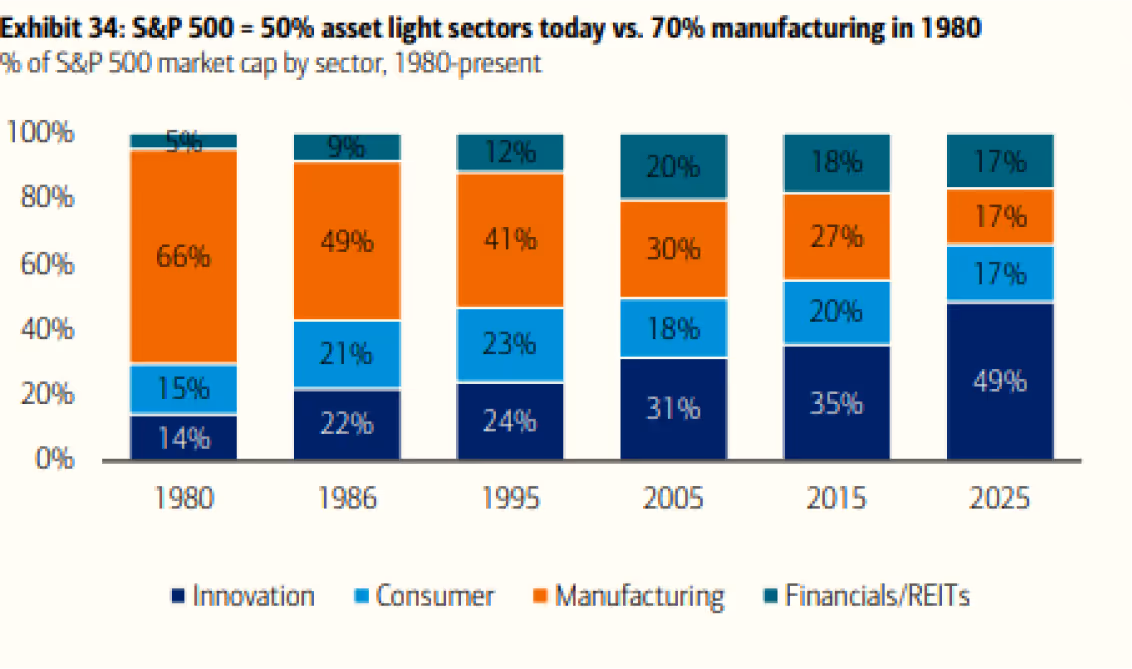
Within our firm, there is an ongoing debate about what constitutes a “fair” multiple for today’s market. The composition of the S&P 500 has shifted meaningfully. Growth-oriented technology and communication services sectors now dominate, while defensive areas like consumer staples and utilities have declined to multigenerational lows.\
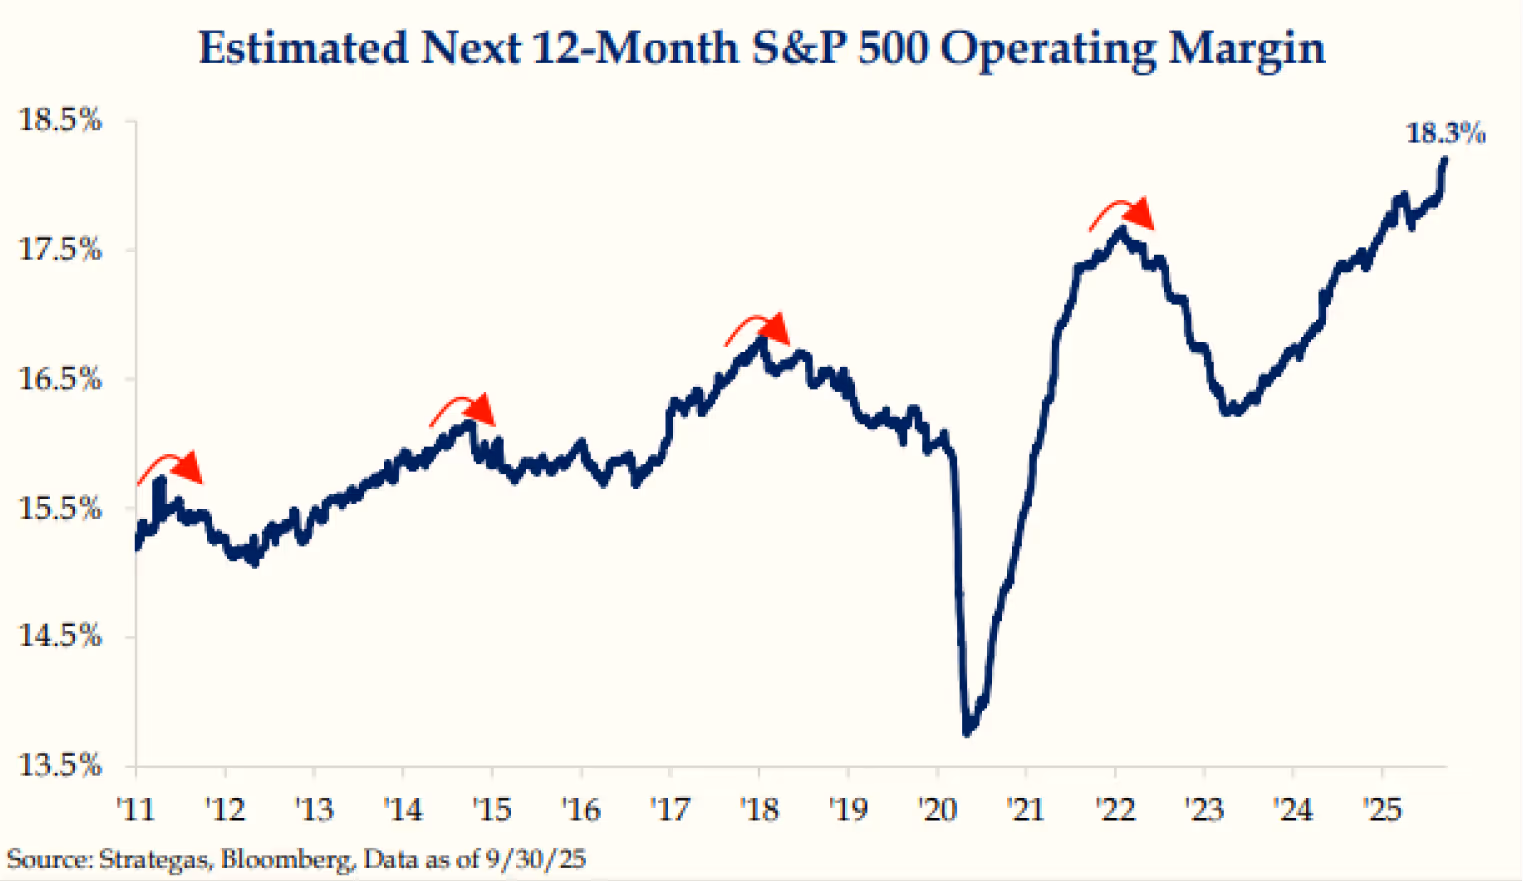
A striking data point: Nvidia’s market capitalization now exceeds that of the entire Consumer Staples, Energy, Utility, Real Estate, and Materials sectors —and is approaching the weight of the entire Industrials sector. This concentration means today’s index reflects businesses with higher profitability, stronger growth, lower capital intensity, and wider competitive moats than in prior eras. S&P 500 operating margins are nearly 300 basis points higher than they were 15 years ago, reflecting this structural transformation.
Does that justify a premium to historical multiples? Absolutely. Does it justify a 41% premium? Only time will tell.
Seasonality
One dynamic remains consistent: markets often behave irrationally in the short run, especially during periods when seasonality exerts its influence. The fourth quarter has historically been one of the stronger periods for equities, supported by performance chasing, year-end fund flows, and the stock market’s forward-looking discounting mechanism. Examples include
- The S&P 500 finished higher 74% of the time in Q4, with an average return of 2.84%.
- NASDAQ has advanced 69% of the time, posting an average return of 6.16%.
Russell 2000 increased 76% of the time, with an average return of 4.58%.6
Third Quarter Market Recap
The third quarter of 2025 demonstrated the resilience of global markets amid evolving economic conditions. Key highlights include the S&P 500's 8.1% quarterly gain, Nasdaq’s impressive 11.4% surge, and gold's exceptional 16.8% rally. The Federal Reserve's initiation of rate cuts in September, combined with better-than-expected economic data and continued momentum in artificial intelligence & the MAG 7, propelled markets to new highs across multiple asset classes.
Most significantly, all major U.S. equity indices reached record highs during the third quarter, while bond markets posted solid gains as yields declined from their summer peaks. Year-to-date, equities have reached record highs on 28 days through Q3 (15% of trading days), compared to the long-term average of 15 days (8% long-term average).7 The quarter's performance was characterized by broadening market participation, with small-cap stocks (Russell 2000) outperforming large-caps and international markets showing renewed strength.
In September, small caps (Russell 2000 +7.1%) outperformed large caps (S&P 500 +2.0%, NASDAQ +1.6%), a move that represents not just a statistical rebound but also a significant technical signal. This breakout was fueled by:
- Expectations of Federal Reserve rate cuts,
- Attractive relative valuations versus large-cap stocks, and
- Strong operating leverage within smaller companies.
Historically, such breakouts often pave the way for extended relative outperformance. We believe investors remain underexposed to this segment of the market, and the foundation is now being set for a period of sustained small-cap leadership.
September marked the fifth consecutive monthly gain for the S&P 500 and sixth consecutive gain for the Nasdaq-100. Momentum was supported by resilient corporate earnings, with Q3 2025 estimated earnings growth for the S&P 500 projected at 7.9% year-over-year, with eight of eleven sectors expected to show positive growth.8
International markets also participated in the rally, with emerging market equities (EEM) leading the way with a 10.6% quarterly return. Chinese markets were particularly strong, gaining 19.8% (USD denominated) for the quarter as trade tensions subsided and AI optimism continued. Canadian markets outperformed the U.S. with gains of 10.1% (USD), while Japanese markets returned 9.1% (USD).
Fixed Income Recovery
Bond markets staged a notable recovery in Q3 after a challenging start to the summer. The Bloomberg Aggregate Bond Index gained 2.04% for the quarter, benefiting from declining yields across the curve and tightening credit spreads. The 10-year Treasury yield ended the quarter at 4.15%, down from peaks above 4.48% reached in July.
Credit markets performed exceptionally well, with high-yield bonds leading fixed income returns at 3.6% for the quarter. Investment-grade corporate bonds gained 1.8%, while emerging market bonds advanced 3.3%. Credit spreads tightened significantly throughout the quarter, reaching historically tight levels by September
Municipal bonds rebounded strongly in Q3, posting their first quarterly gain of the year after underperforming in the first half of 2025. This recovery reflected improving state and local government finances, as well as increased demand for tax-advantaged income.
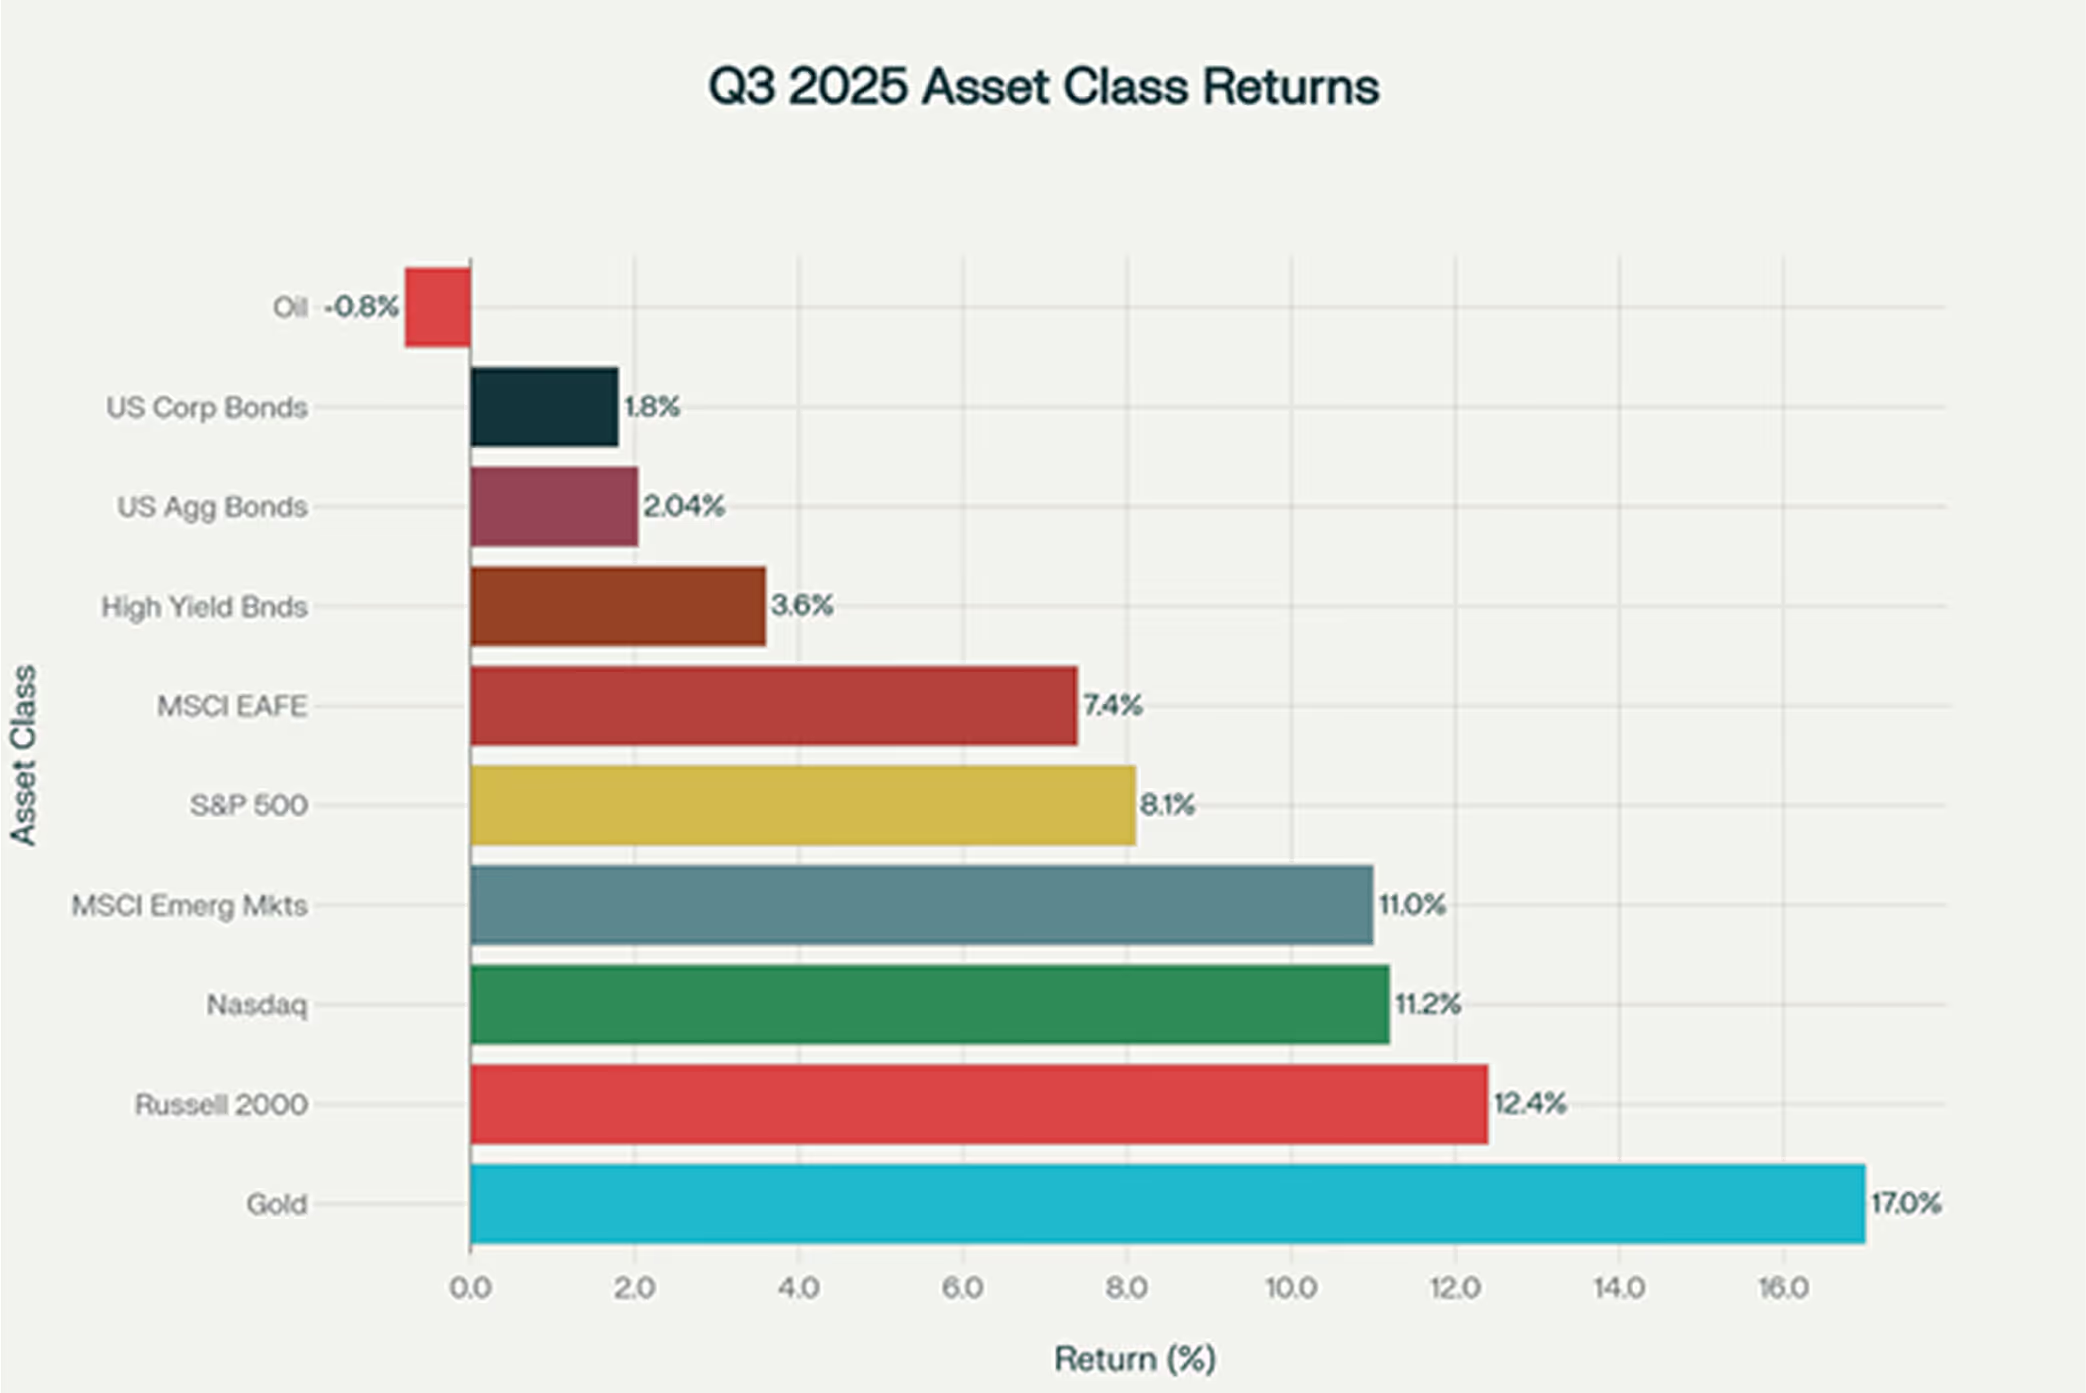
Q3 2025 asset class performance showed broad-based gains led by gold at 17% and strong equity performance across domestic and international markets.
Commodity Performance
Gold emerged as the standout performer across all asset classes in Q3 2025, gaining 17% for the quarter. Multiple factors, including safe-haven demand, expectations of continued Federal Reserve rate cuts, and ongoing geopolitical uncertainties, drove this exceptional performance. Gold is experiencing its best annual performance since 1979.
Energy markets presented a mixed picture, with crude oil declining 0.8% for the quarter despite elevated geopolitical tensions. The oil market faced headwinds from expectations of oversupply and concerns about slowing global economic growth, particularly in manufacturing sectors.
Current Economic Landscape
GDP and Growth Dynamics
The U.S. economy demonstrated remarkable resilience in Q3 2025, with revised Q2 GDP growth reaching 3.8% annualized, up from initial estimates of 3.3%. This upward revision was driven by stronger-than-expected consumer spending, which continues to serve as the backbone of economic expansion.10,11
Looking ahead to Q3 GDP, economists project growth could reach as high as 4.0%, driven by robust consumer spending and business investment. The Atlanta Fed's GDP tracker currently estimates Q3 growth at 3.9%, reflecting the underlying strength of the U.S. economy despite various headwinds.11
However, economic momentum is expected to moderate as we move into 2026. Forecasters anticipate GDP growth will slow to approximately 2.0% annually as the effects of higher interest rates and trade uncertainties begin to weigh more heavily on economic activity. 12,13
Labor Market Evolution
The labor market continues to show signs of gradual cooling, with unemployment rising to 4.7% as of the latest data. Job creation has slowed significantly, with recent months showing more modest employment gains compared to the robust hiring seen in 2024. 12,14,15,
This labor market softening has become a key factor in Federal Reserve policy considerations, with policymakers increasingly focused on supporting employment alongside their price stability mandate. The combination of moderating job growth and declining inflation has created conditions supportive of monetary policy easing.15,16
Inflation Outlook
Inflation pressures continue to evolve, with core PCE inflation reaching 2.7% in August 2025. While this remains above the Federal Reserve's 2% target, the trajectory suggests continued progress toward price stability, albeit at a gradual pace.17,18
However, inflationary pressures are expected to accelerate in Q4 2025, with forecasters predicting that headline CPI could reach 3.0% by the fourth quarter. This expected increase is primarily attributed to the ongoing impact of import tariffs and rising energy costs. 17,18
Food price inflation remains elevated at 3.2% annually, reflecting supply chain pressures and weather-related disruptions. The USDA projects food prices will continue rising at above-average rates through 2025 before moderating in 2026.19
Federal Reserve Policy and Interest Rate Environment
September Rate Cut and Forward Guidance
The Federal Reserve initiated its rate-cutting cycle in September 2025 with a 25-basis point reduction, bringing the federal funds rate to 4.25-4.50%. Fed Chair Jerome Powell characterized this as a "risk management cut," designed to guard against growing economic uncertainty rather than respond to a clear downturn. The Fed continues to view tariffs as inflationary, though their pass-through effects remain slower and more muted than initially feared.15,20
Markets are pricing in additional rate cuts through the end of 2025, with a 98% probability assigned to another 25-basis point cut at the October meeting and a 90% probability for December. Bank of America has recently moved its forecast for the next rate cut to October from December, citing signs of a softening labor market.15,21
The current government shutdown, which began on October 1st, has complicated the Federal Reserve's data-dependent approach to monetary policy. With key economic data releases delayed, policymakers may err on the side of caution, potentially supporting the case for additional rate cuts.16
Yield Curve and Term Structure
The Treasury yield curve has steepened during Q3 2025, with short-term yields falling more dramatically than long-term rates. The 10-year Treasury yield currently stands at 4.16%, while 2-year yields have declined to 3.55%.
This curve steepening reflects market expectations for continued Fed easing in the near term, while long-term yields remain elevated due to persistent fiscal concerns and structural inflationary pressures. The 30-year Treasury yield remains above 4.70%, indicating investor caution about longer-term economic prospects.13,22
Asset Allocation Strategy for Q4 2025
Equity Allocation Recommendations
U.S. equities remain attractively positioned for Q4 2025, supported by continued earnings growth, AI-driven productivity gains, and accommodative monetary policy. Technology and growth stocks should maintain their leadership role, particularly companies benefiting from artificial intelligence investments and infrastructure development.22
Small-cap equities deserve increased attention following their strong Q3 performance and potential to benefit disproportionately from lower interest rates. The Russell 2000's recovery suggests improving sentiment toward domestically focused companies that could benefit from reduced financing costs.22
International equity exposure should be maintained or potentially increased, particularly in emerging markets where valuations remain attractive and policy support is evident. Chinese markets have shown renewed strength following trade policy improvements and domestic stimulus measures. But this trend isn't likely to continue.22
Fixed Income & Currency Positioning
Bond allocations should emphasize flexibility and duration management in the current environment. While yields remain attractive at current levels, the potential for further Fed rate cuts suggests maintaining some duration exposure to benefit from potential yield declines.23,24,25
Credit exposure should be carefully managed given historically tight spreads, but all-in yields near 5% continue to provide attractive income opportunities. Investment-grade corporate bonds offer better risk-adjusted returns than high-yield, given the current spread environment.24,26
Treasury Inflation-Protected Securities (TIPS) merit consideration given expectations for rising inflation in Q4 2025. Real yields on TIPS remain attractive, particularly for investors concerned about the inflationary impact of tariffs and fiscal policies.13,17
Currency markets may see continued U.S. dollar weakness as interest rate differentials narrow and global growth differentials shift. This could benefit international investments and commodity prices. Nevertheless, the direction of currency movements is particularly difficult to predict and safe haven demand in combination with increased Foreign Direct Investing into the United States could also accelerate a resurgence in demand for the US Dollar. 27,28
Alternative Assets and Diversification
Gold should remain a core portfolio holding given its exceptional performance and continued relevance as an inflation hedge and safe-haven asset. The metal's strong momentum and supportive fundamental backdrop suggest further gains are possible.31,32
Real estate investment trusts (REITs) may benefit from the lower interest rate environment, though careful sector selection is crucial given the varying impacts of economic trends on different property types.27
Commodity exposure should be selective, with energy investments requiring careful consideration of supply-demand dynamics and geopolitical factors that could drive price volatility.31,32
Macroeconomic Risk Factors and Strategic Considerations
Geopolitical and Policy Uncertainties
Geopolitical risks remain elevated in 2025, with ongoing tensions between major powers creating potential market volatility. The U.S.-China relationship, while showing improvement through trade negotiations, continues to influence global supply chains and investment flows.31,32
Trade policy uncertainties persist as a key market driver, with tariff implementations affecting inflation expectations and corporate profitability across various sectors. Investors should monitor these developments closely as they could significantly impact asset allocation decisions.11,13
The current U.S. government shutdown adds near-term uncertainty to economic data releases and potentially Fed policy decisions. While historically brief, extended shutdowns could begin to impact economic activity and market sentiment.16
Inflation and Monetary Policy Risks
The primary risk to current market optimism lies in persistent inflationary pressures that could limit the Federal Reserve's ability to ease monetary policy. Should inflation accelerate more than expected, the Fed may need to pause or reverse its easing cycle.13,17
Supply chain disruptions and tariff impacts could prove more persistent than currently anticipated, potentially pushing inflation higher and forcing more aggressive Fed action. This scenario would negatively impact both equity and bond markets.17,18
Fourth Quarter Economic Outlook
Q4 2025 GDP growth is expected to remain robust but begin moderating from Q3's strong pace. Consumer spending should remain supportive, though growth rates may normalize as the effects of previous stimulus measures fade.12,13
Business investment is likely to remain strong, supported by artificial intelligence spending and improving financing conditions. However, trade policy uncertainties may constrain corporate expansion plans.13
Strategic Asset Allocation Framework
A balanced approach emphasizing quality and flexibility appears most appropriate for Q4 2025.22 This includes:
- Maintaining overweight positions in U.S. equities while adding international exposure
- Emphasizing technology and growth stocks with AI exposure
- Managing duration risk in fixed income while capturing attractive yields
- Maintaining gold allocation as portfolio insurance
- Remaining selective in credit exposure given tight spreads
Sources:
All performance data obtained from Bloomberg
- https://awealthofcommonsense.com/2025/08/is-this-1996-or-1999/
- https://www.cnbc.com/2025/09/23/fed-powell-stock-prices-appear-fairly-highly-valued.html
- https://www.cnbc.com/2025/09/23/fed-powell-stock-prices-appear-fairly-highly-valued.html
- Strategas; October 1, 2025, pg. 6
- BofA Securities, September 29, 2025, pg. 14.
- BofA Securities, September 24, 2025, pg. 1.
- Advisor Upside/Vanguard, October 7, 2025
- https://am.jpmorgan.com/gb/en/asset-management/per/insights/market-insights/market-updates/monthly-market-review/
- Strategas; October 1, 2025, pg. 14.
- https://www.bea.gov/news/2025/gross-domestic-product-2nd-quarter-2025-third-estimate-gdp-industry-corporate-profits
- https://fortune.com/2025/09/27/economic-outlook-gdp-forecast-q3-4-percent-consumer-spending-income-recession-warning/
- https://www.nuveen.com/global/insights/investment-outlook/2025-q4-outlook-the-economy-and-markets
- https://www.deloitte.com/us/en/insights/topics/economy/us-economic-forecast/united-states-outlook-analysis.html
- https://www.resolutionfoundation.org/publications/labour-market-outlook-q3-2025/
- https://www.reuters.com/business/bofa-global-research-moves-fed-rate-cut-forecast-october-december-2025-10-03/
- https://www.cnbc.com/2025/10/01/lockdown-fed-interest-rates.html
- https://www.investopedia.com/inflation-is-running-high-what-experts-expect-for-q4-2025-11816488
- https://tradingeconomics.com/united-states/inflation-cpi
- http://www.ers.usda.gov/data-products/food-price-outlook/summary-findings
- https://www.nahb.org/blog/2025/09/fed-cuts-rates
- https://money.usnews.com/investing/news/articles/2025-10-03/bofa-global-research-moves-fed-rate-cut-forecast-to-october-from-december
- https://www.blackrock.com/hk/en/insights/global-investment-outlook
- https://www.morningstar.com/bonds/bond-markets-end-q3-high-note
- https://corporate.vanguard.com/content/dam/corp/articles/pdf/afi_perspectives_q3_2025_the_power_of_income.pdf
- https://www.wellington.com/en-us/intermediary/insights/whats-current-in-credit-march-2025
- https://www.breckinridge.com/insights/details/q3-2025-corporate-bond-market-outlook/
- https://am.jpmorgan.com/gb/en/asset-management/per/insights/market-insights/market-updates/monthly-market-review/
- https://www.fidelity.com/viewpoints/market-and-economic-insights/quarterly-market-update
- https://www.morningstar.com/markets/13-charts-q3s-tech-driven-rally
- https://www.nasdaq.com/articles/september-third-quarter-2025-review-and-outlook
- https://www.s7risk.com/navigating-geopolitical-uncertainty-strategies-for-2025/
- https://www.spglobal.com/en/research-insights/market-insights/geopolitical-risk