
In Q1, the debate of “soft” versus “hard” landing seems to have given way to a calmer environment. As noted by Fed Chairman Jerome Powell: “The overall picture continues to be one of solid growth, a strong but rebalancing labor market, and inflation moving down toward 2% on a sometimes bubbly path.”
We balance this comment with the view that while the U.S. is showing signs of economic stabilization, any inflation surprises to the upside could result in a bumpier path.
- Inflation moderated – as the Fed’s preferred measure of inflation, the Personal Consumption Expenditures Index, rose 2.5% YoY for all prices, down from their peaks in 2022. Headline inflation was 3.2%, due to higher shelter and raw materials costs; and the Fed held rates steady.
- U.S. GDP grew 3.4% YoY in Q4: an upward revision from the prior estimate of 3.2%.
- Unemployment remained under 4%, despite layoffs in the technology sector. A reading above 4% may trigger the Fed to cut rates.
- Manufacturing rebounded following 16 months of contraction, with the ISM’s manufacturing PMI at 50.3 in March. Rising raw material prices pose a potential obstacle and could push up goods inflation.
- 10-year Treasury yield steepened, while the yield curve remains inverted. A stock market correction tends to occur when the 10-year yield moves above 5%.
Risky assets rallied, while long-term bonds sold off:
- The S&P 500 returned 10.6% in Q1. The rally broadened beyond mega-cap technology stocks, while 2 of the “Magnificent 7” declined. Quality (financially healthy) and Momentum factors outperformed, while Value and Size (small companies) factors underperformed.
- Bonds fell -0.7%, led by long-term treasuries (-3%), while high yield was up 1.5%.
- Global stocks (ex-US) underperformed (+4.3%) – as Japan, UK, Germany, and Canada entered recessions and the broader slowdown continued in China.
U.S. equity valuations, Fed policy, and the upcoming presidential election remain key themes for 2024.
1. Hang tight as stock markets break new all-time highs
Year-to-date, the S&P 500 has had approximately 20 new all-time highs. While positive for investors, do new all-time highs mean that the market is due for a pullback?
Figure 1 shows that during a bull market cycle, major stock market indices naturally spend a significant amount of time near record levels. For instance, 2021 experienced 70 days with the market closing at new all-time highs, adding to the hundreds that have been reached since 2013.
Figure 1. Stock Market at All-Time Highs
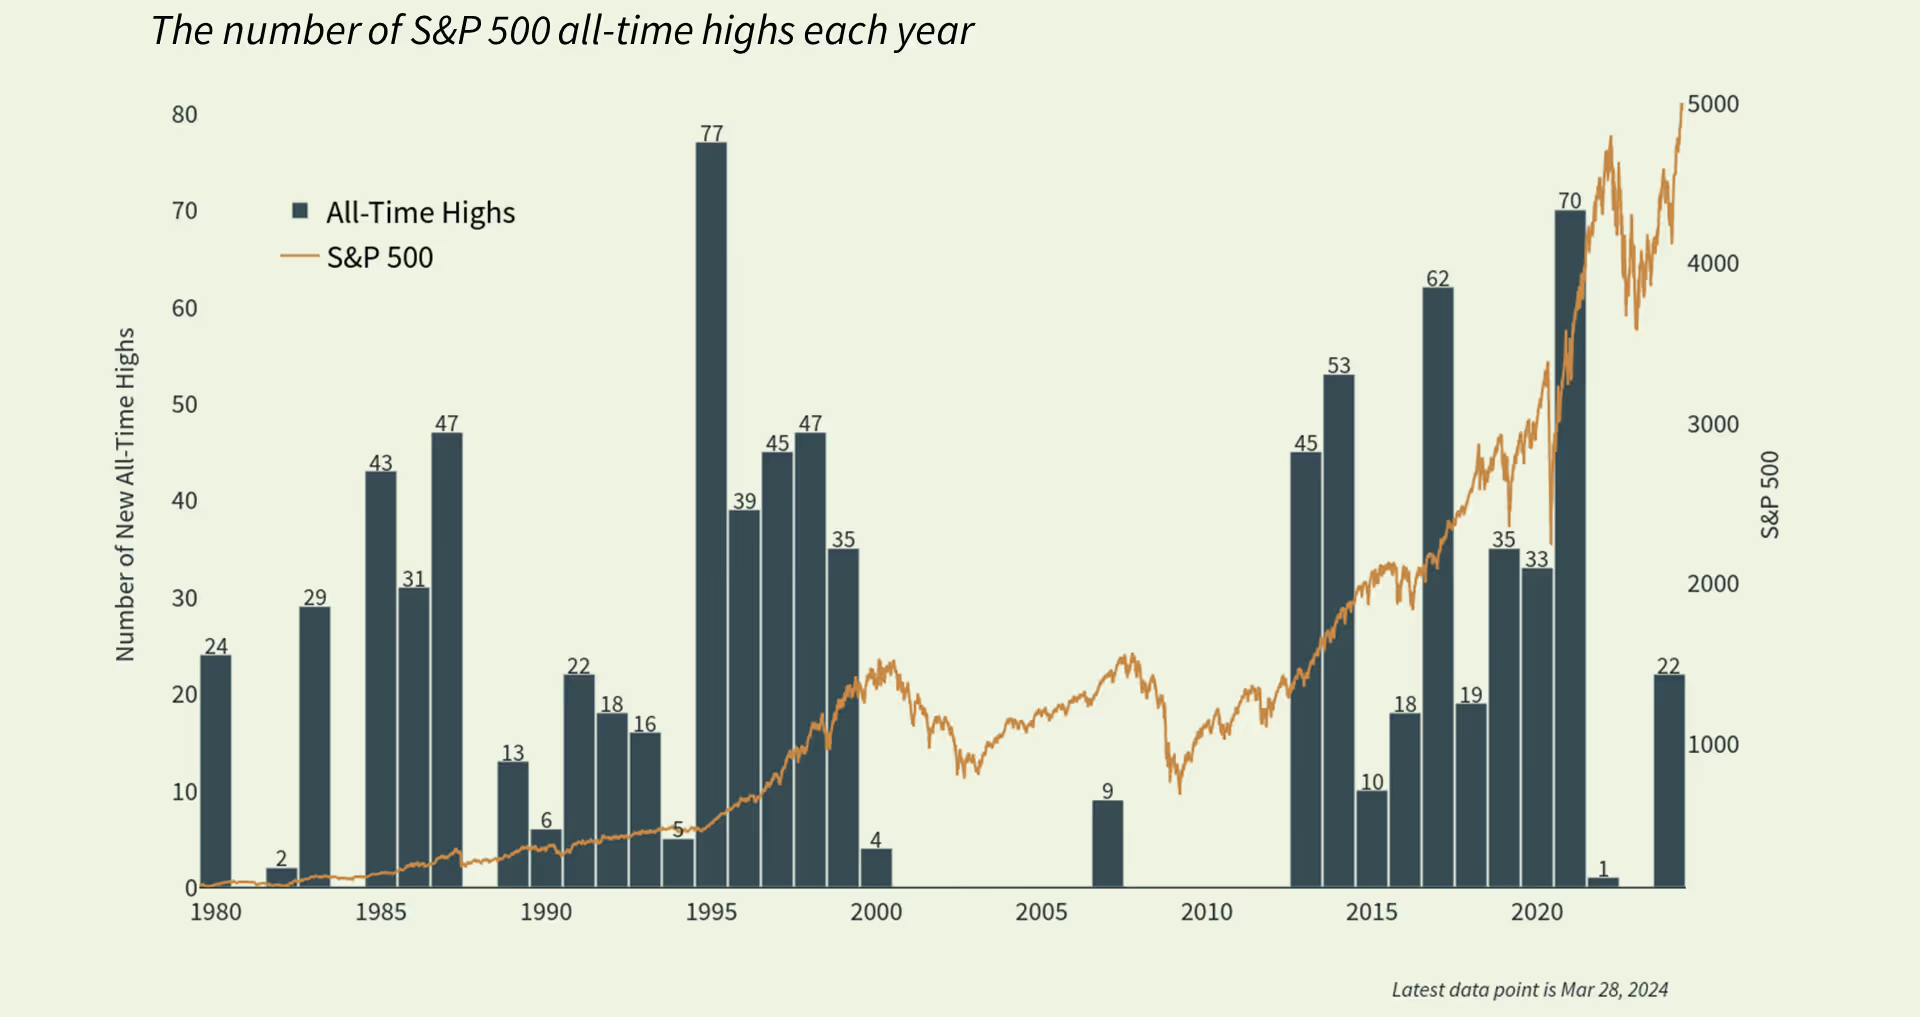
Sources: Clearnomics, Standard & Poor's
While pullbacks do occur during bull markets and current equity valuations are elevated, they may not reach unsustainable extremes if corporate earnings continue to catch up. Avoiding pullbacks may be costly, as one would also miss most of the rallies.
2. The Fed delayed rate cuts, as headline inflation remained above 3%
At its last meeting, the Fed cited strong job gains and low unemployment as indicators of solid economic activity, but emphasized that “the Committee does not expect it will be appropriate to reduce [interest rates] until it has gained greater confidence that inflation is moving sustainably toward 2 percent.”
Figure 2. Federal Funds Rate
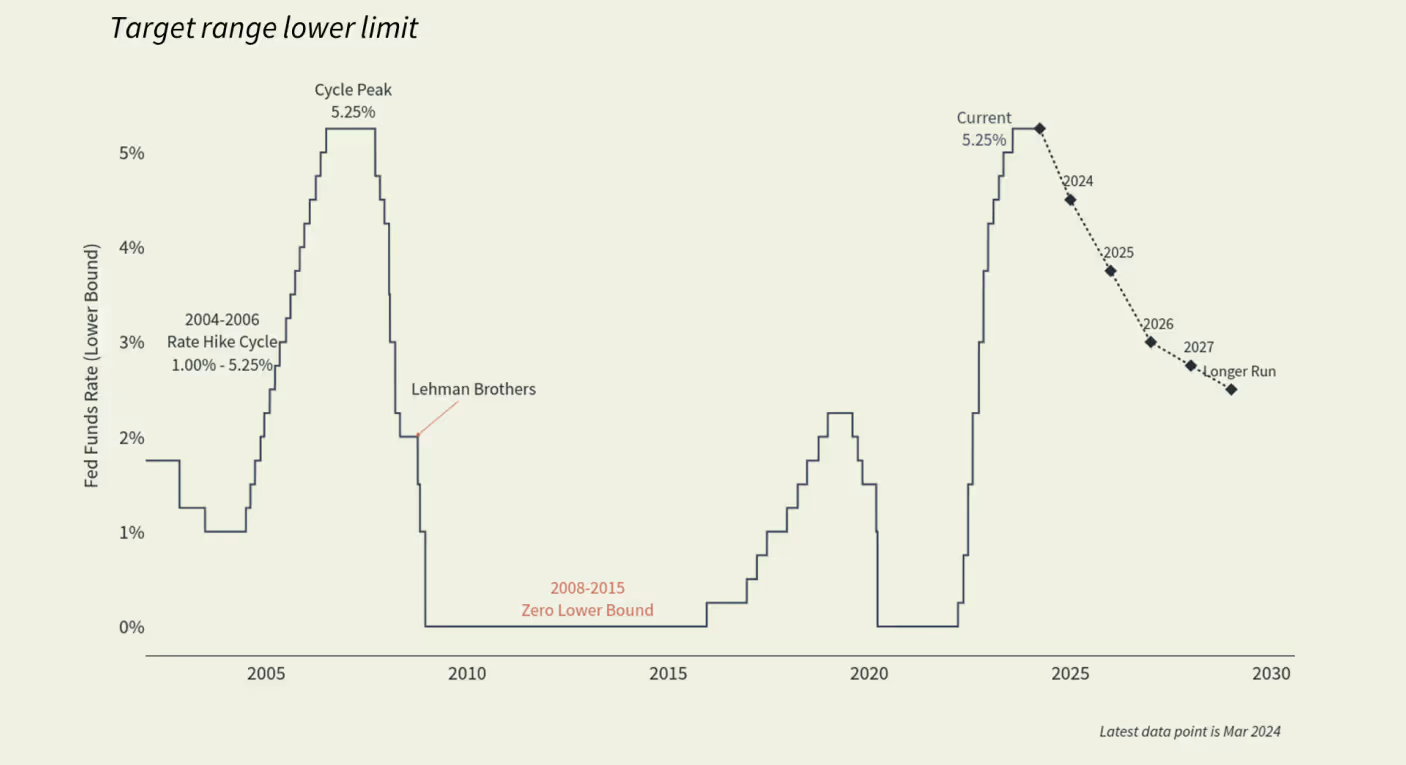
Sources: Clearnomics, Standard & Poor's
While interest rates receive all of the media coverage, the Fed has a less-talked-about monetary policy tool: the money supply. Quantitative tightening (QT), where the Fed reduced its balance sheet, continued in Q1 (Figure 3). While it’s not likely to reverse the effect of quantitative easing on interest rates, a declining money supply would help reduce inflation.
Figure 3. The Federal Reserve’s Balance Sheet
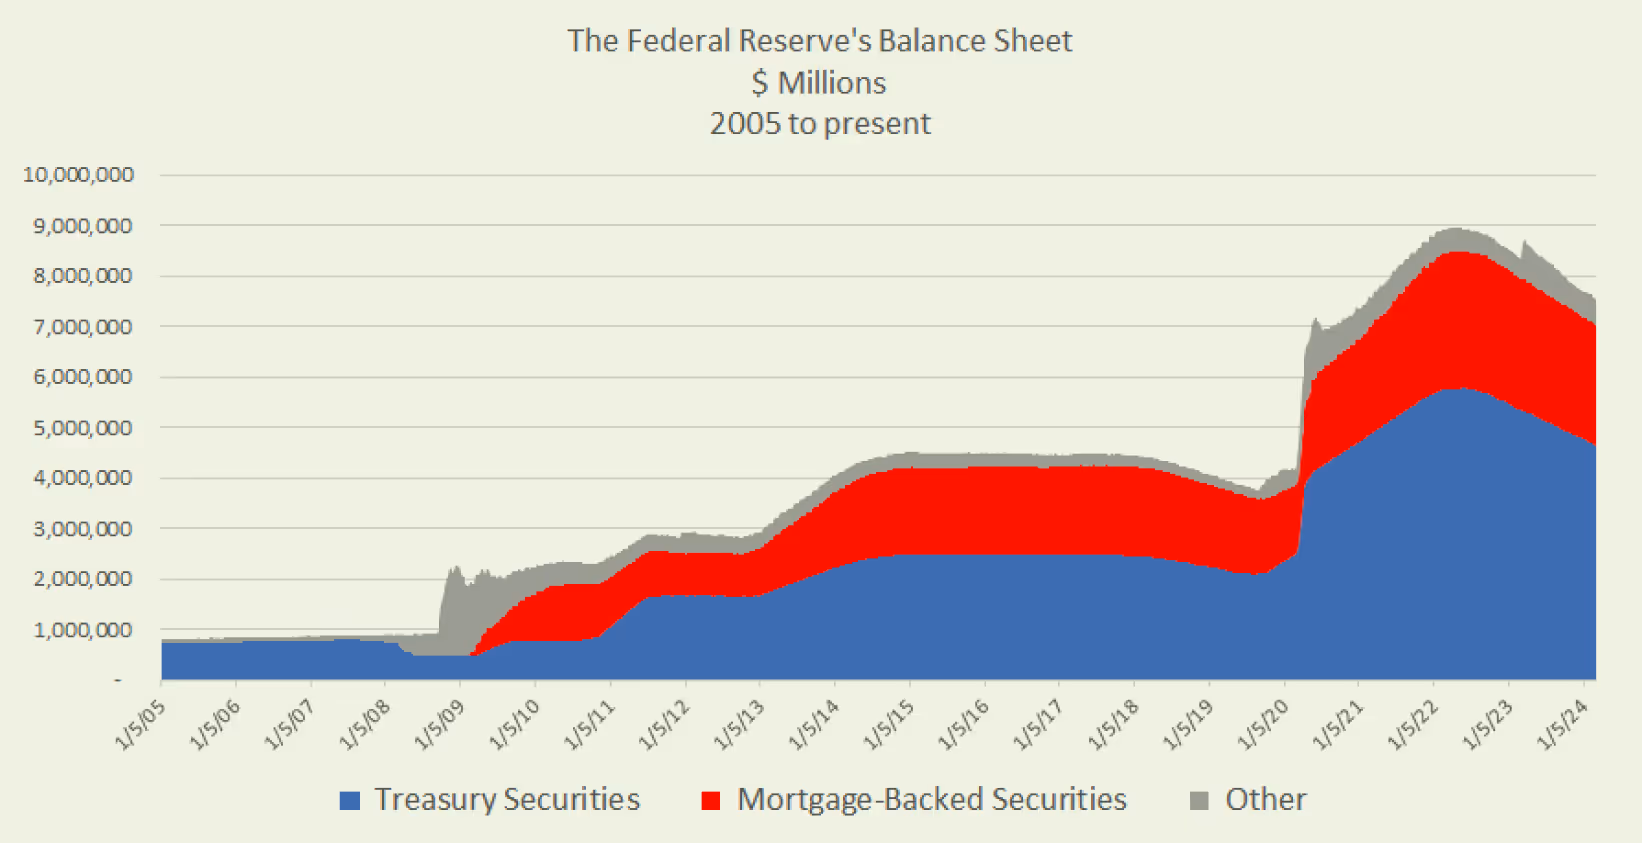
Source: American Action Forum: The Federal Reserve’s Balance Sheet Assets
3. “Election year coin toss”
With polls showing a coin toss as to who wins the presidential, congressional, and senatorial elections: we have the potential to see any of the scenarios in Figure 4. In other words, polls may lack predictive power in stock market returns.
Figure 4: Average annual S&P 500 returns since 1953 by party control
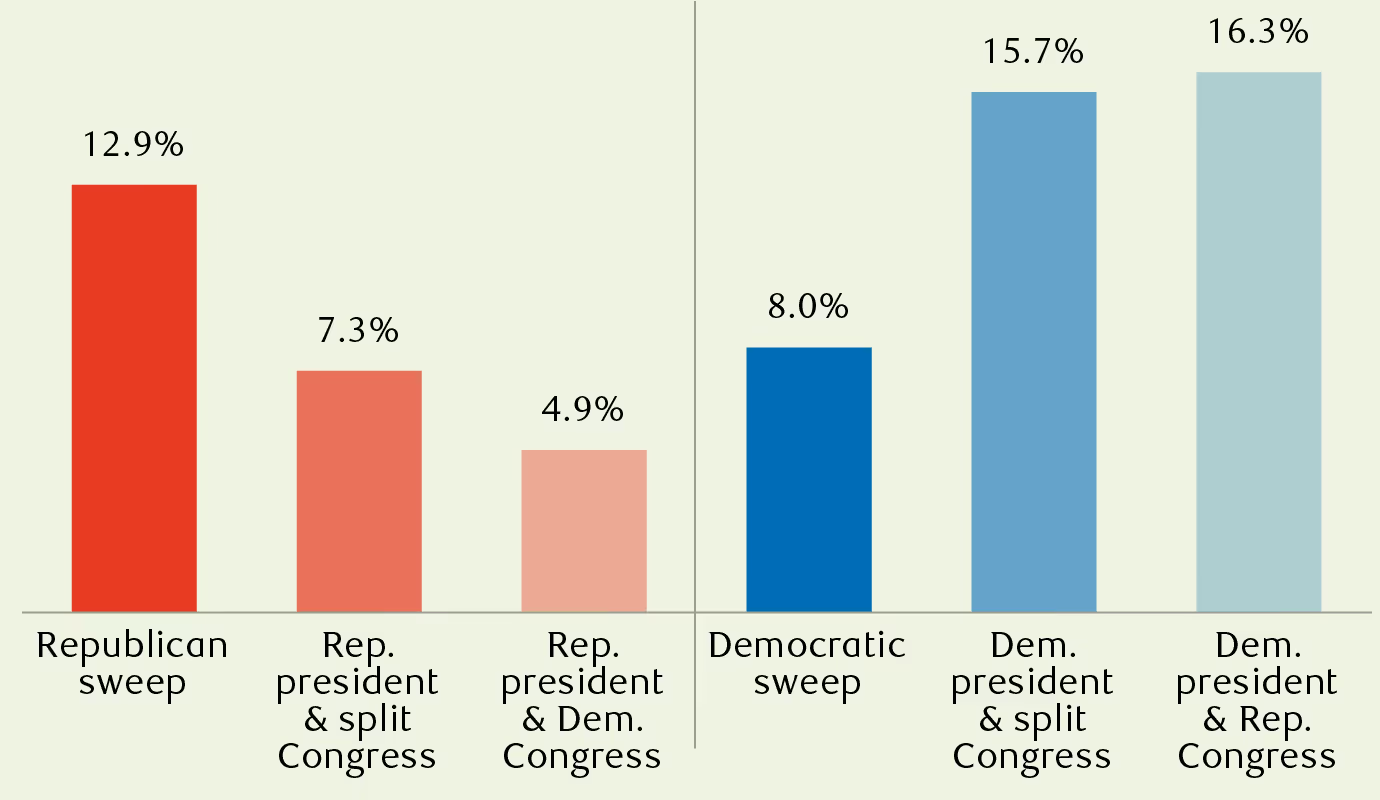
Source: 1. RBC Wealth Management, Bloomberg; data through 12/31/23; data based on price returns (does not include dividends)
However, “stock market returns [leading up to the election] have accurately depicted who will win in 87% of elections since 1928. Data shows that the probability of the incumbent party losing is high if the stock market drops before the election. If the stock market value rises, there may be a higher probability of the incumbent parting winning.”1
Bear in mind that business cycles can have a stronger influence on market returns than presidencies. Thus, actual occurrences rarely turn out as “average” and can very much skew it. The Clinton years, for instance, benefited greatly from the long expansion of the 1990s. The George W. Bush years, on the other hand, overlapped with both the dot-com crash and the 2008 global financial crisis.
Investors can monitor whether the “stock market election predictor” pans out this year, while staying invested in long-term portfolios.
4. Dynamic Asset Allocation - Adjustment Rationale
While conditions in the U.S. have stabilized, the global economy appears to struggle, due to the lack of timely and sufficient stimulus and policy support. We are adjusting the asset allocations in our Dynamic Multi-Asset Portfolios to reflect these trends, as well as relative valuations.
In equities, we are decreasing the allocation to Developed Market Equities and adding to U.S. Mid Cap, which tends to do well in the current “goldilocks” regime. We are trimming Infrastructure due to the sector’s sensitivity to rising raw materials costs and long term interest rates.
In fixed income, we are reducing duration as the 10-year Treasury yield rises, maintaining Short-Term Treasury as yields/risk remains attractive, and adding to Investment Grade as spreads continue to narrow.
These dynamic adjustments reflect our comprehensive top-down perspective and are designed to help client portfolios weather changing economic and market regimes.
We invite you to connect with your Farther wealth advisor for questions related to our Dynamic Multi-Asset Portfolios or Q1 Market Commentary.