.avif)
What a difference a month can make. After an early summer rally through mid-August, U.S. stock and bond markets have now dropped below their June lows, with inflation continuing to be higher than expected. Federal Reserve Chairman Jerome Powell has taken a more hawkish tone about combating inflation, even at the risk of causing an increase in unemployment and a recession (as communicated in August at the Fed’s Jackson Hole conference and reiterated following the September FOMC decision). Markets have sold off, as market participants have come to expect a higher Federal Funds rate next year and an increased chance of a recession in the U.S. as a result of this monetary tightening.
The Federal Reserve has indicated that it will aggressively fight inflation to make up for the policy mistakes (monetary and fiscal) of the past two years. While the current inflationary environment has had multiple drivers, at its heart, it has been driven by too much money chasing a constrained amount of goods. The U.S. had trillion-dollar fiscal stimulus packages in both 2020 and 2021. The Federal Reserve kept short-term interest rates near zero and was buying bonds for its balance sheet until March of this year – 1 year after inflation started to rise above its long-term 2% target. Supply chains have been slower to return to normal, due to the pandemic. The omicron wave slowed U.S. growth in the first quarter of 2022, and China is still locking down parts of its economy to pursue its zero-Covid policy. The combination of stimulus, supply chains that are still not back to pre-pandemic operations, and the war in Ukraine has led to our current situation in which inflation in the U.S. is running over 8% YoY.
It's important to note that this is a particularly bad year for both the stock and the bond markets. As of September 26th: the S&P 500 stock index was down -22.4%, and the Bloomberg Aggregate bond index was down -14.8%. While the stock market losses in the tech-bubble burst of the early 2000s and the global financial crisis in 2008-2009 were twice as large, the bond market served as a buffer to those losses in diversified portfolios.
To put these market moves into a historical perspective, we wanted to provide some data regarding average annual returns and calendar year declines for both the S&P 500 and Bloomberg Aggregate (courtesy of J.P. Morgan Asset Management). For the 42 years between 1980 and 2021, the S&P 500 experienced an average intra-year decline of 14%, even while the average annual return was 9.4%. This year’s sell-off, while nasty, is not outside of historic norms for bear markets.
S&P 500 Intra-Year Declines vs. Calendar Year Returns
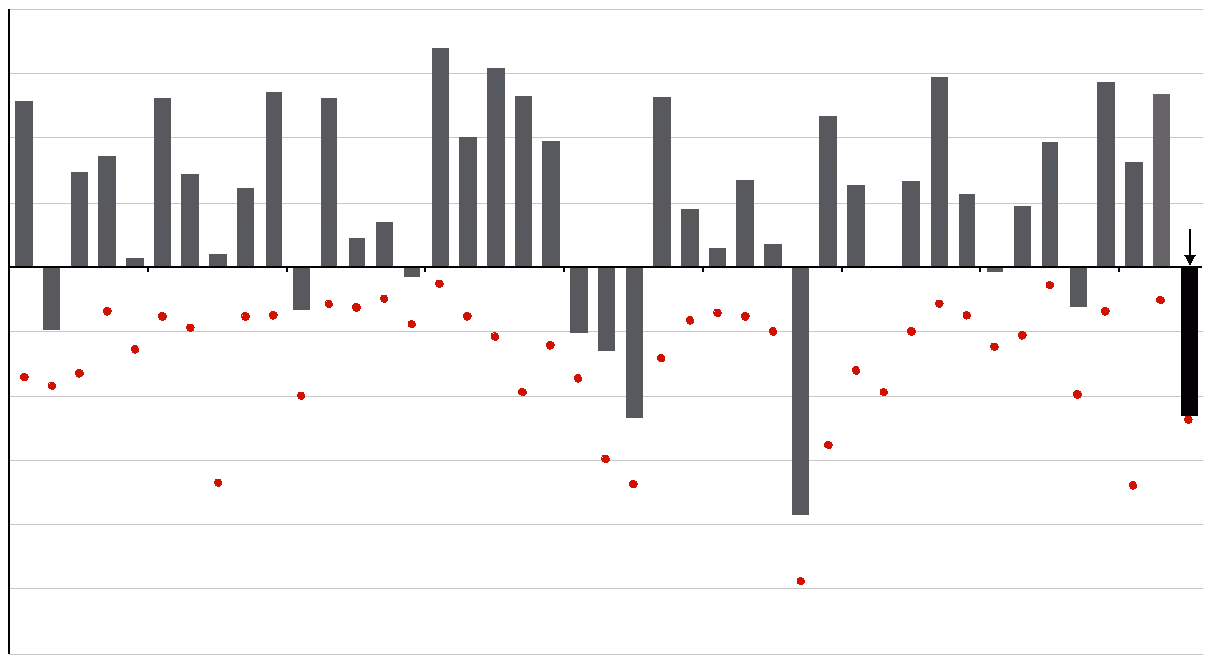
Source: FactSet, Standard & Poor’s, J.P. Morgan Asset Management. Returns are based on price index only and do not include dividends. Intra-year drops refers to the largest market drops from a peak to a trough during the year. For illustrative purposes only. Returns shown are calendar year returns from 1980 to 2021, over which time period the average annual return was 9.4%. J.P. Morgan Asset Management Guide to the Markets – U.S. Data as of September 26, 2022.
For the Bloomberg Aggregate, for the 46 years between 1976 and 2021, bonds had an average intra-year decline of 3.1%. Notably, this year’s return of -14.8% is the worst intra-year decline for the US bond market – even worse than the last inflationary period of the late 1970s.
Bloomberg U.S. Aggregate Intra-Year Declines vs. Calendar Year Returns
Despite average intra-year drops of 3.1%, annual returns were positive in 42 of 46 years.
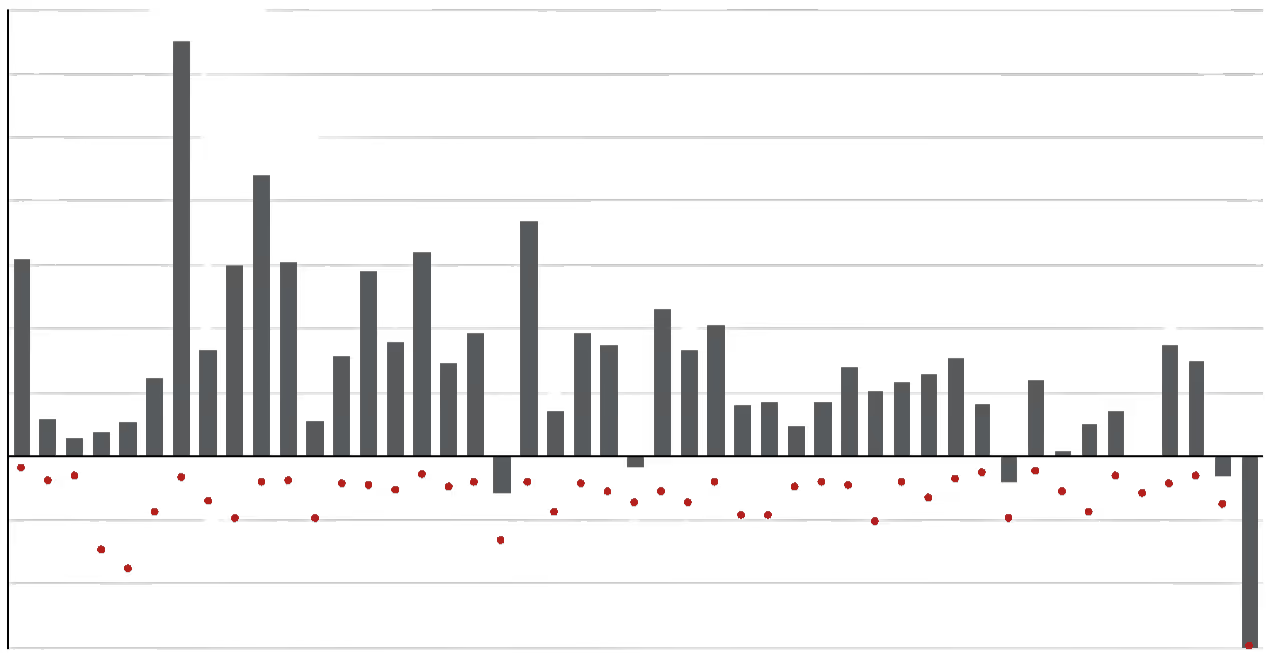
Source: Bloomberg, FactSet, J.P. Morgan Asset Management. Returns are based on total return. Intra-year drops refers to the largest market drops from a peak to a trough during the year. For illustrative purposes only. Returns shown are calendar year returns from 1976 to 2021, over which time period the average annual return was 7.1%. Returns from 1976 to 1989 are calculated on a monthly basis; daily data are used afterwards. J.P. Morgan Asset Management Guide to the Markets – U.S. Data as of September 26, 2022.
Successful long-term investing is about compounding future returns over years, not focusing on day-to-day or month-to-month market moves. Volatile markets can provide attractive entry points for investors. It is very difficult to time the market and predict its near-term future; however, prospective returns are more attractive today for the long-term in both stocks and bonds. We continue to recommend using market volatility to dollar-cost average into portfolios and to rebalance portfolios to your long-term allocation. Clients may also want to consider incorporating other alternative asset classes such as private equity, venture capital, private credit, or hedge funds, where appropriate – to add sources of return outside the public markets. We encourage you to speak with your advisor and discuss whether any changes are necessary for your portfolio.
---
David Darby
David serves as Chair of the Farther Investment Committee and also advises a select group of clients. With over 25 years of experience working with high-net-worth families, entrepreneurs, and executives, David brings particular expertise in managing multi-asset portfolios of public and private investments. He has spent his career helping clients successfully structure, execute, and implement complex planning strategies.
David was an advisor at Goldman Sachs for 21 years, prior to co-founding DG Wealth Partners, an independent RIA in 2017. DG Wealth Partners merged with Farther in 2022. David and his wife, Helen, live in Palm Beach Gardens, Florida, with their three children.