.avif)
Key Takeaways:
- Currently, the Federal Reserve’s hoped-for soft landing has become the 2024 Wall Street consensus. The Wall Street consensus, however, is not always correct. Right or wrong, it is important to understand the consensus views as it affects markets and may create opportunities in different asset classes.
- It is easy to focus on things to worry about in the near-term: bank failures, whether a soft landing turns into a recession, or stocks becoming too expensive. These provide excuses to not invest (or stay invested). However, being uninvested can be one of the most expensive mistakes for an investor with a long-term horizon. The U.S. equity market increased approximately 40 times from 1980 through 2023 – despite recessions, stock market crashes, wars, a terrorist attack, and a pandemic.
- It is important to understand the valuations of the asset classes we invest in. Both the absolute valuations of asset classes, and their valuations relative to their own history and each other, give important portfolio construction signals.
Our current outlook on portfolio positioning is as follows:
- For cash balances, invest in U.S. Treasury securities. Rates are expected to fall in 2024: extend the maturity and lock in yield on your cash.
- It is still an attractive time to buy high quality bonds. Fixed income is again providing income to portfolios after years of low yields.
- Valuations matter for U.S. stocks, but are a better long-term than short-term predictor of returns. Today’s valuations are higher than average, but not outrageously so, and are consistent with 5-7% annual returns over the next 5 years.
- International stocks continue to look cheap, on both an absolute and relative basis when compared to U.S stocks.
We do not know the future and should not bet on one specific economic scenario and market response. Investors should build flexible portfolios that can weather multiple possible outcomes.
2023: A Brief Review
2023 was certainly an eventful year for the economy, financial markets, and in geopolitics.
Major events included:
- The United States did not fall into a recession, which had been the Wall Street consensus coming into the year (following slow growth in 2022).
- Financial markets performed well in 2023, in the wake of 2022’s difficult performance.
- Political gridlock in the U.S. led to a near failure to raise the debt ceiling in May, a U.S. debt downgrade in summer by Fitch to AA+, and Moody’s changing its Aaa outlook on U.S. debt to negative in November. These factors added to volatility in the fixed-income markets during the year.
- U.S. Consumer Price Inflation (CPI) fell to 3.1% year-over-year in November 2023, down from a high of 9.1% in June 2022. Note that a lower positive inflation rate does not mean lower prices, but rather, that prices are increasing at a lower rate than at their peak.
- The Federal Reserve increased overnight interest rates 4 times by 0.25% each to a target of 5.50% but has paused since July. The Federal Reserve has continued to state that it is targeting a 2% inflation rate and has signaled that they expect to lower rates in 2024 as the inflation rate has continued to fall.
- 3 large U.S. banks – Silicon Valley Bank, Signature Bank, and First Republic Bank – and Credit Suisse in Switzerland failed and were bailed out.
- The world remained on edge militarily. The Ukraine/Russia War is nearing the end of its second year, and Hamas started a war with Israel on October 7th, which has the potential to lead to a broader conflict in the Middle East.
- Tension between China and the U.S. remained high. A bus-sized Chinese spy balloon flew over the U.S. in February, before being shot down off the coast of South Carolina. Xi Jinping was elected to a third presidential term in China in March. Concerns surrounding China’s intentions toward Taiwan led to a meeting between Presidents Biden and Xi at this fall’s APEC summit in San Francisco to lower tensions. Some progress was made in the relationship, as evidenced by the resumption of high-level talks between the American and Chinese militaries in December.
Financial Markets Review: Surprisingly Strong Returns
Financial markets experienced a strong 2023, following 2022’s poor performance for both stocks and bonds. As we wrote last January, valuations were attractive for both stocks and bonds entering the year. Markets were able to shrug off recession concerns, banking crises, and interest rate volatility to end higher on the year – though not without an equity market correction in the fall, when the 10-year U.S. Treasury yield rose quickly to 5%.
- Large-cap U.S. stocks continued to outperform small-cap stocks, and growth stocks far outperformed value stocks.
- Bonds had a positive return, in line with their yield at the start of the year.
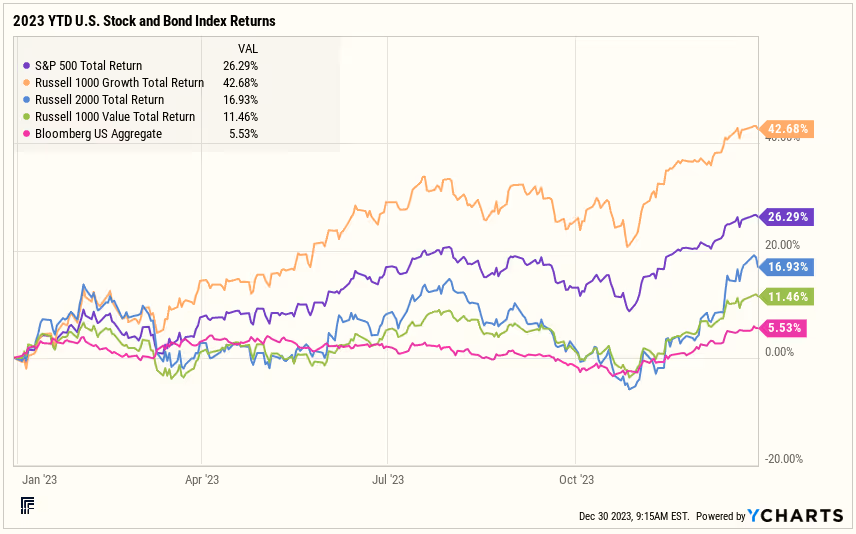
- The S&P 500 Index returned +26.3%, while the small cap Russell 2000 Index returned +16.9%.
- The Russell 1000 Growth Index returned +42.7% – outperforming the Russell 1000 Value Index, which was up +11.5%.
- The Bloomberg US Aggregate Bond Index returned +5.5%.
- The 7 largest stocks in the S&P 500 contributed to most of the S&P 500’s return. The so-called “Magnificent Seven” – Apple, Microsoft, Alphabet, Amazon, NVIDIA, Meta and Tesla – saw returns ranging from +49% for Apple to +239% for NVIDIA. To provide a sense of the contribution of the other 493 stocks in the S&P 500: the equally weighted S&P 500 Index was up +13.7%.
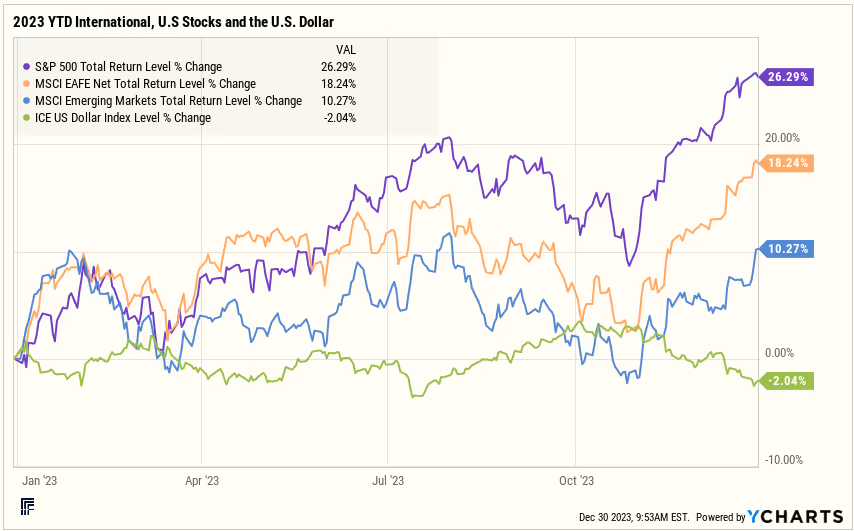
The U.S. stock market also outperformed both developed and emerging market international stocks. The MSCI EAFE Index returned +18.2%, while the MSCI Emerging Markets Index returned +10.3%. The U.S. dollar index was down -2.0%, proving a modest tailwind to international equity returns.
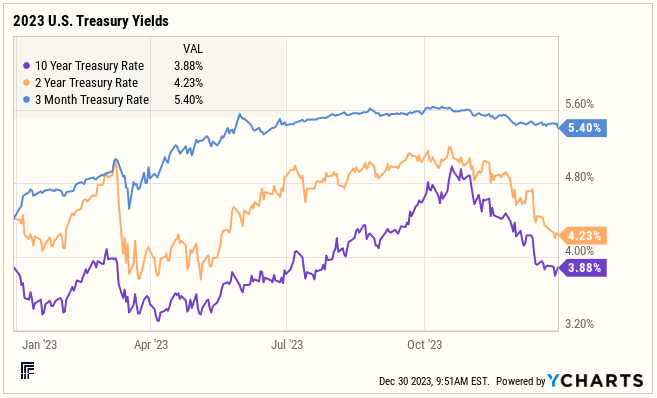
During 2023, short-term Treasury rates rose, as the Federal Reserve raised its overnight Federal Funds rate by 1.00% through July. Treasury Bills followed those rate increases, while 2-year Treasury yields fell slightly. 10-year Treasuries began and finished the year at nearly the same rate. However, Treasury yields were quite volatile during the year. Interest rates fell precipitously, following the failure of Silicon Valley Bank in March. Rates then began to rise in the spring through October, as the bond market became concerned about several factors: the political gridlock around the debt ceiling increase, a stronger than expected economy, and increased Treasury issuance after the debt ceiling was raised. In late October, as economic data started to cool, the bond market staged a ferocious rally – with the 10-year Treasury yield falling over 1.1% into year-end.
Several market reactions during this past year seem illogical on the surface:
- Why were long-term interest rates unchanged for the year, when the inflation rate has fallen?
- Why are stocks and earnings multiples higher, when interest rates stayed flat for the year?
- Why is the price of oil down, when there’s a war in the Middle East with the potential to spread in a major way if Iran and its proxies further provoke Israel, the U.S., or Saudi Arabia?
Markets tend to be forward-looking, but are not perfect predictors of the future. Markets may be looking past near-term problems to a brighter future, or they may be ignoring possible risks. One only knows which one of those possibilities is true when enough time has passed; hindsight is 20/20, and the future is impossible to know with precision. Successful long-term investing requires the humility to acknowledge that we do not know the future – and to not bet on one specific economic scenario and market response. Investors should prepare for many possible outcomes and build portfolios that can weather multiple possible futures.
2024 Economic Outlook and Risks
We are not in the business of making specific predictions on the economy or markets. We leave that to Wall Street firms, while noting that the Wall Street consensus is not always correct. The consensus forecast for a recession in 2023, which did not occur, has evolved into the current view that the Federal Reserve’s hoped-for soft landing will become a reality in 2024. Right or wrong, it is important to understand the consensus views, as that affects markets and may create opportunities in different asset classes.
U.S. Economy
A soft landing is now the Federal Reserve’s expectation for next year: lower growth, but not a recession. Following the December FOMC meeting, the Federal Reserve adjusted its median consensus estimates for 2024 GDP growth to ~1.5%, a fall in inflation to below 2.5%, a slight increase in the unemployment rate to 4.1%, and a total of three 0.25% cuts to the overnight Federal Funds rate by the end of 2024.
This is a historically hard-to-execute Goldilocks scenario for the economy. At some point, the U.S. economy will enter a recession: business cycles, which include over-expansion, and a resulting contraction, have not ended. The timing and depth of recessions are hard to predict in advance. Even more significantly, the financial market response to a recession can vary broadly – depending on the causes, the monetary and fiscal responses, and the expected severity and length of the recession.
Banking Crisis
The collapses of Silicon Valley Bank and Signature Bank in March and First Republic Bank in May were major events that we have written about at length earlier this year. In summary, these major events were caused by a combination of the rapid increase in long-term interest rates (affecting the value of the banks’ assets) and the rise in short-term interest rates and competition from higher-yielding, risk-free assets – causing rapid deposit flights of their low-cost uninsured deposits. While the FDIC ultimately guaranteed all of the deposits of these banks, their failures highlighted the importance of understanding FDIC and SIPC insurance limits, that all cash is not created equally, and the importance of investing your cash in the safest U.S. Treasury securities.
The factors that led to these bank failures are still present and affect regional banks more than large banks. Short-term rates (i.e. banks’ funding costs) are still high. Higher long-term rates are still negatively impacting the value of the securities on banks’ balance sheets, although not as badly as at the end of the third quarter. Commercial real estate loans, which have seen some pressure and are likely to see more in 2024, are more concentrated in regional banks’ balance sheets than large banks. These factors could lead to more failures in 2024. It is hard to know the economic and financial market fallout or whether the government would guarantee all deposits of a failed bank. Recall that in 2008, political pressure against bailouts rose throughout the year – and eventually led to the disorderly collapse of Lehman Brothers (rather than a bailout). We are not predicting that type of outcome, but highlighting that we do not know what might happen if a bank were to fail during the election season. The one thing we can do is to prepare in advance for that possibility and to make certain that our clients’ cash is invested safely in U.S. Treasuries. The fact that T-Bills are currently yielding over 5% is a bonus to being safe.
Geopolitical Risks
We can unequivocally state that global tensions are high and rose in 2023. As mentioned earlier in this piece: the Russian invasion of Ukraine is nearing its second anniversary, and Hamas launched a surprise attack on Israel on October 7th, leading to an active war between Israel and Hamas in Gaza. Tension between China and the U.S., particularly surrounding Taiwan, remains high.
It is easy to imagine a worse 2024 on all of these fronts. Russia could use a nuclear device in Ukraine (what’s another Chernobyl in Ukraine to Russia?). Iran or its proxies could enter the war against Israel – Iranian-backed Houthi rebels are presently attacking commercial ships in the Red Sea – potentially broadening the war to include the U.S. or Saudi Arabia. China could attempt to move against Taiwan, while the U.S. is distracted supporting its allies in Ukraine and Israel, or during a contentious U.S. election.
On the other hand, positive scenarios are equally plausible. U.S. aid could allow quicker resolutions to the Ukraine/Russia or Israel/Hamas wars. China could continue to only saber rattle against Taiwan, particularly if U.S. aid and resolve helps end other global conflicts. Regardless, geopolitics should continue to remain an area of surprise in 2024.
Elections
While we cannot and will not make a prediction on the 2024 U.S. Presidential Election, we can make a few observations about election years and the stock market. According to data from First Trust: since the 1928 election, 20 of 24 presidential election years have had positive returns, averaging 11.6%. Two of the negative years occurred this millennium: 2000 (when the internet bubble started to burst) and 2008 (during the global financial crisis).
2024 Financial Market Outlook
While we leave specific stock and bond market predictions to Wall Street analysts, we think it is important to understand the valuations of the asset classes we invest in. Both the absolute valuations of asset classes, and their valuations relative to their own history and each other, provide important portfolio construction signals. Studying these indicators can help us make tactical changes to buy assets when they are cheaper and sell when they are more expensive.
Cash: Invest Safely, But Do Not Fall in Love with Today’s High Rates
We have written extensively about how to keep cash safe and generate yield, versus a bank account: invest in U.S. Treasury Bills, Money Market Funds, or ETFs. The below chart highlights just how much one’s yield can be improved by investing in U.S. Treasuries, without any concern of a bank failure. For larger cash balances that one does not need in the coming months, extend the maturities of the cash portfolio to lock in yield. The Federal Reserve and financial markets both expect lower rates in 2024. The Fed expects 3 cuts (0.75%) in rates next year, and markets are pricing in six cuts (1.5%). As of December 29, 3-month T-Bills were yielding 5.40%, 12-month T-Bills were yielding 4.78%, and the 2-year T-Note was yielding 4.23% – implying that the market expects 12-month T-Bill rates to fall to 3.68% in a year.
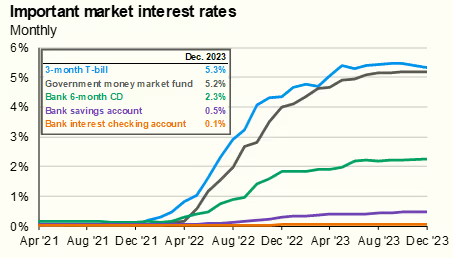
Source: Bankrate, Bloomberg, Crane Data, FDIC, Federal Reserve, J.P. Morgan Asset Management Guide to the Markets. Bank rates reflect FDIC national rates, which are defined as the average of rates paid by all insured depository institutions and credit unions for which data is available, weighted by each institution's share of domestic deposits. Data are as of December 31, 2023.
Fixed Income: The Income is Back in Fixed Income
Bond yields are roughly the same today as they were at the start of 2023, despite the fall in rates since October. Higher starting yields historically lead to higher returns in bond portfolios. Changes in interest rates drive the rest of the return in Treasuries: when rates rise, returns fall. Conversely, when rates fall, returns rise. When starting at higher yields, bonds can withstand more of the impact of rising rates and still have positive returns, as can be seen in this year’s bond market returns.
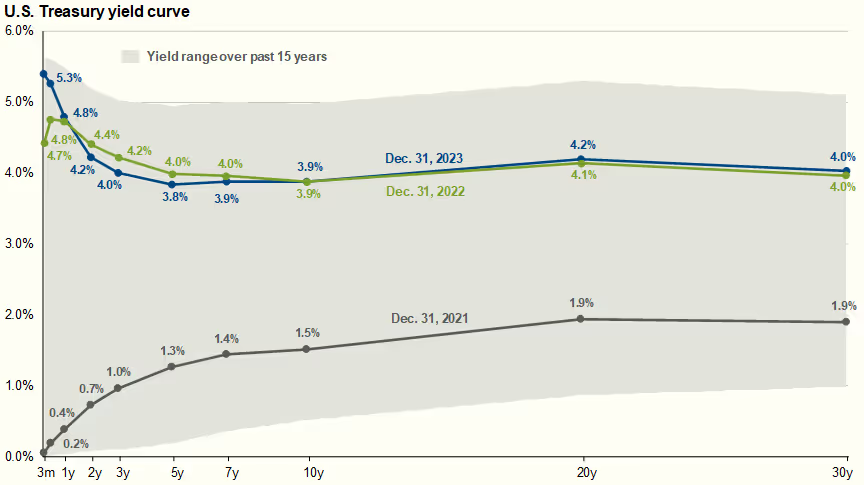
The following chart shows Treasury yield curves at several snapshots in time. The blue line represents the Treasury yield curve at the end of 2023 and the green line the yield curve at the end of 2022 – substantially the same across most of the curve at the beginning and end of the year, but over 2% higher than at the end of 2021 (the black curve). Yields are still near the high end of their range over the past 15 years, as represented by the shaded area of the chart.
We still believe it is an attractive time to buy high quality bonds – as a result of the higher yields, lower inflation, and the positive expected real (inflation-adjusted) return in bonds. If rates unexpectedly rise, today’s higher yields should serve as a buffer against losses – as they did through most of 2023 – and may present a further buying opportunity. Importantly, fixed income is again providing income to portfolios, following years of low yields.
Source: FactSet, Federal Reserve, J.P. Morgan Asset Management. Guide to the Markets – U.S. Data are as of December 31, 2023.
For our taxable clients, we believe tax-free municipal bonds are priced fairly on an after-tax basis, relative to taxable bonds. Currently, after-tax yields on 1-10-year AAA municipals are approximately 0.10% higher than comparable Treasuries. Opportunities tend to arise in the municipal market to build or add to portfolios, especially when rates rise quickly, as they did earlier in the fall. For example, in October, 1-10-year AAA municipals were yielding over 1.00% higher than comparable Treasuries on an after-tax basis, according to data from J.P. Morgan Asset Management.
In the high-yield taxable bond space, traditional fixed-rate high-yield bonds are priced at a tighter than average spread of 3.77% over treasuries, compared to a long-run average of 5.64%, according to data from J.P. Morgan Asset Management. At this pricing level, high-yield bonds are priced in line with the soft-landing scenario and would do well in a situation of falling absolute yields and an economy with low defaults. On the other hand, high-yield bonds would likely perform worse in a recession scenario of increased defaults and rising credit spreads.
Floating rate high-yield bank loans are positioned more favorably at present. Publicly traded, broadly syndicated loans are currently yielding 10.6% and can be purchased via ETFs or actively managed mutual funds. Bank loans are positioned higher in a company’s capital structure than bonds and equity – and are the first to be repaid in a bankruptcy. Private credit funds offer even higher yield opportunities, but should be carefully considered – as they come with additional risks and cannot be indexed like public securities.
Equities: U.S. Stocks are Getting Expensive, while International Stocks Remain Cheap
Stock markets are the hardest financial markets to predict in advance, particularly over short periods of time. Successful investing requires the humility to acknowledge that we cannot predict the future, and thus, should not bet everything on one outcome.
The math that drives stock market returns over time depends on different factors than bonds. Returns are driven by companies’ earnings growth, their dividends, and any change in the price/earnings (P/E) ratio that one pays for the stocks and sells (or continues to hold) them at. Valuation does matter for U.S. stocks. In general, buying stocks at a lower P/E ratio leads to higher returns over time. While U.S. stocks have been notable compounders of wealth over decades, they are not always the best asset class to buy at every point in time. The absolute valuation of stocks and their relative valuation to different asset classes matters, but history shows that valuation is not a good short-term predictor of returns.
The charts below help to illustrate both the difficulty of predicting near-term returns, based on current valuation, and the far stronger effect that current valuation has had on 5-year returns. The chart on the bottom left shows 1-year returns (the y-axis) based on starting valuations (the x-axis). As indicated, returns historically have been about as good when stocks are expensive (20+ starting P/Es) as when they are cheap (low teens starting P/Es). However, the chart on the bottom right shows a tighter correlation between lower P/Es and higher forward returns. Importantly, when expected P/Es start around 23x, forward returns on U.S. stocks have been flat to negative. At today’s current PE of 19.5, 5-year returns in U.S. stocks are consistent with 5-7% annual returns over the coming 5 years.

Source: FactSet, Refinitiv Datastream, Standard & Poor’s, Thomson Reuters, J.P. Morgan Asset Management.
Returns are 12-month and 60-month annualized total returns, measured monthly, beginning 11/30/1998. R² represents the percent of total variation in total returns that can be explained by forward price-to-earnings ratios. Price-to-earnings is price divided by consensus analyst estimates of earnings per share for the next 12 months, as provided by IBES since February 1998 and by FactSet since January 2022. Guide to the Markets – U.S. Data are as of December 31, 2023.
The following chart provides a longer-term perspective on the U.S. S&P 500 Index, with some important reference points about the forward P/E ratios and interest rates at various peaks and troughs in the market. The 2000 peak in the market before the tech bubble burst had both a high P/E of 25.2x and an earnings yield of under 4%, while risk-free Treasuries yielded 6.2%. Both the absolute valuation of stocks and the relative valuation to bonds led to a period of 12 years of flat performance in the U.S. stock market. S&P 500 earnings grew, while the P/E ratio fell roughly in half.
The important question for U.S stocks is whether we are in nosebleed territory (like in 2000). The answer appears to be “no”. Today’s forward P/E ratio of 19.5 is nearly 6 points lower than in 2000 and is consistent with mid-single digit returns, based on history. Importantly, the 10-year Treasury’s yield of 3.9% is lower than the 5.1% earnings yield of stocks. U.S. stocks have benefited from being the “best house on the block” over the last 15 years in the equity markets. The natural strengths of the United States, including (but not limited to) the strong economy supported by the rule of law, technological innovation, energy independence, a strong military, and friendly neighbors surrounded by two oceans have led to a significant expansion of P/E multiples over the past 15 years, which is unlikely to repeat itself.

Source: Compustat, FactSet, Federal Reserve, Refinitiv Datastream, Standard & Poor’s, J.P. Morgan Asset Management.
Dividend yield is calculated as consensus estimates of dividends for the next 12 months, divided by most recent price, as provided by Compustat. Forward price-to-earnings ratio is a bottom-up calculation based on IBES estimates and FactSet estimates since January 2022. Returns are cumulative and based on S&P 500 Index price movement only, and do not include the reinvestment of dividends. Past performance is not indicative of future returns. Guide to the Markets – U.S. Data are as of December 31, 2023
International stocks continue to look cheap, both absolutely and relative to U.S valuations. One international stock index (the MSCI ACWI ex-US Index) had an estimated P/E ratio of 12.9x at year-end, a discount of 34% to the S&P 500 – twice its normal discount. U.S and international stocks tend to have long periods in which one asset class outperforms the other. The international MSCI EAFE Index (which includes Europe, parts of Asia, and the Far East) outperformed the S&P 500 for the first 7 years of the millennium – while over the last 16 years, the S&P 500 has led the MSCI EAFE Index. Prior cycles of outperformance in the 1980s and ‘90s tended to be shorter – between 4 and 6 years. It is difficult to predict when the outperformance of the U.S stocks will change, but it makes sense to have international equity exposure at these valuations. The potential for a falling dollar (when the Federal Reserve lowers rates) could also provide a tailwind for international equity returns.

Alternative Investments: Selective Areas of Interest
Alternative investments offer interesting opportunities, but investors need to be selective regarding which funds they invest in – unlike the public markets, alternatives cannot be invested in via indices. Alternative managers have much wider dispersions of returns between top-tier and bottom-tier manager returns than public market managers, as seen in the chart below.

Source: Burgiss, NCREIF, Morningstar, PivotalPath, J.P. Morgan Asset Management.
Global equities (large cap) and global bonds dispersion are based on the world large stock and world bond categories, respectively. *Manager dispersion is based on the annual returns for U.S. Fund Global Equities, U.S. Fund Global Bonds, Hedge Funds, and U.S. Core Real Estate are over a 10-year period ending 3Q 2023. Non-core Real Estate, Global Private Equity and Global Venture Capital are represented by the 10-year horizon internal rate of return (IRR) ending 2Q 2023. U.S. Fund Global Equities and Bonds are comprised of U.S.-domiciled mutual funds and ETFs. Data are based on availability as of December 31, 2023 from the J.P. Morgan Guide to Alternatives.
It is important to focus on a manager’s track record in their space, to assess the market they are investing in, to understand how they access deal flow, and to determine how their past performance is likely to continue. One area to be cautious about is large funds that have experienced large asset inflows. For example, several large private real estate funds that had large inflows in 2021 and early 2022 aggressively put their new capital to work during that time. When investors asked for redemptions in late 2022, those funds put up redemption gates to limit their investors’ ability to withdraw capital.
On the other hand, private equity and VC managers with flexible mandates to invest in different types of deals, managers focused on middle markets, and managers who can purchase deals attractively on the secondary market seem better positioned for the current environment. Middle market direct lending also appears attractive at present, for the reasons discussed earlier in our section on high-yield bonds. In this area, it is very important to use managers who are disciplined about the amount of leverage they extend to their portfolio companies. Your advisor can speak more about some of the funds that our firm finds attractive for clients at present.
Concluding Thoughts: Focus on the Long-Term Horizon
While it is an interesting intellectual exercise to consider which asset classes are relatively attractive at present, and important to make tactical shifts in portfolios when markets present opportunities, the truth is that there is no accurate crystal ball that tells you exactly how to invest over the short-term.
It is easy to focus on near-term concerns: bank failures, whether a soft landing turns into a recession, or stocks becoming too expensive. These potential issues provide excuses to not invest or stay invested. Being uninvested can be one of the worst mistakes for an investor with a long-term horizon. As the below chart indicates, the U.S. equity market increased approximately 40 times from 1980 through mid-2023 – despite numerous serious events for the United States: six recessions, a terrorist attack, three wars, several stock market crashes, a global financial crisis, and a global pandemic.
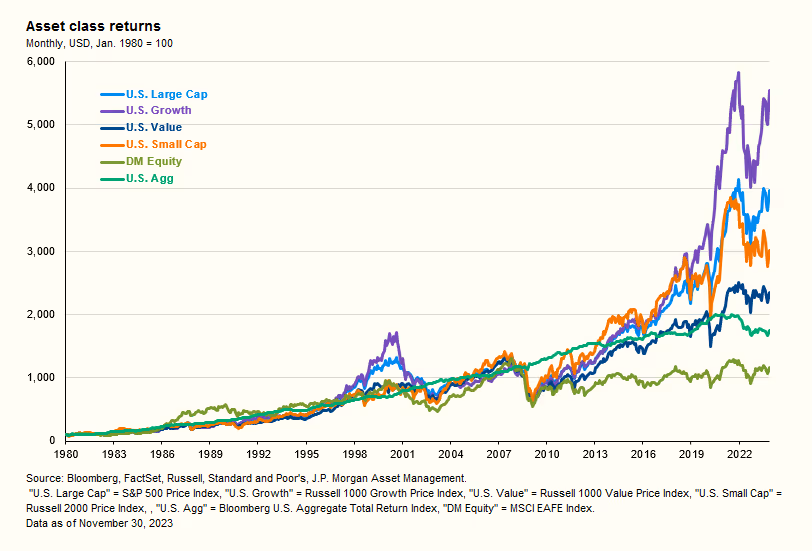
As always, inflation is the enemy of the investor. During the same period as the above chart, inflation increased nearly 4 times, according to the U.S. Bureau of Labor Statistics. While the rapid inflation of the past three years has frustrated citizens and investors, over a longer time frame, remaining invested has allowed investors to beat inflation handsomely.
An important caveat is that it is very important to match your asset classes to your investing horizon, and to understand whether you are in a savings mode (and can have a long horizon), or spending mode (and need to have a shorter time-horizon). If your investment horizon is short-term, your portfolio should be weighted more heavily in lower-risk assets such as cash and bonds. If your time-horizon is long-term (decades or more), then more volatile assets with higher growth potential like stocks and alternatives make sense. A long investing timeframe can help you withstand periods of market volatility and overvaluation. Investors can have both short- and long-term horizons for different goals in their lives, such as saving for a new home purchase in the coming year and saving for their retirement in the coming decades. We encourage you to have ongoing discussions about aligning your investment portfolios with your investment goals.
Finally, we hope that our readers enjoyed the holidays with their family and friends, and we wish you a happy and healthy 2024. Please connect with your Farther advisor regarding any of the topics covered here.
Lauren Moone, CFA, contributed to this piece.
Cover Photo: Jock Bradley, Floating House in Fog.